Price Action Trading for Deriv: Reading Swings, Trends and Candles Without Indicators
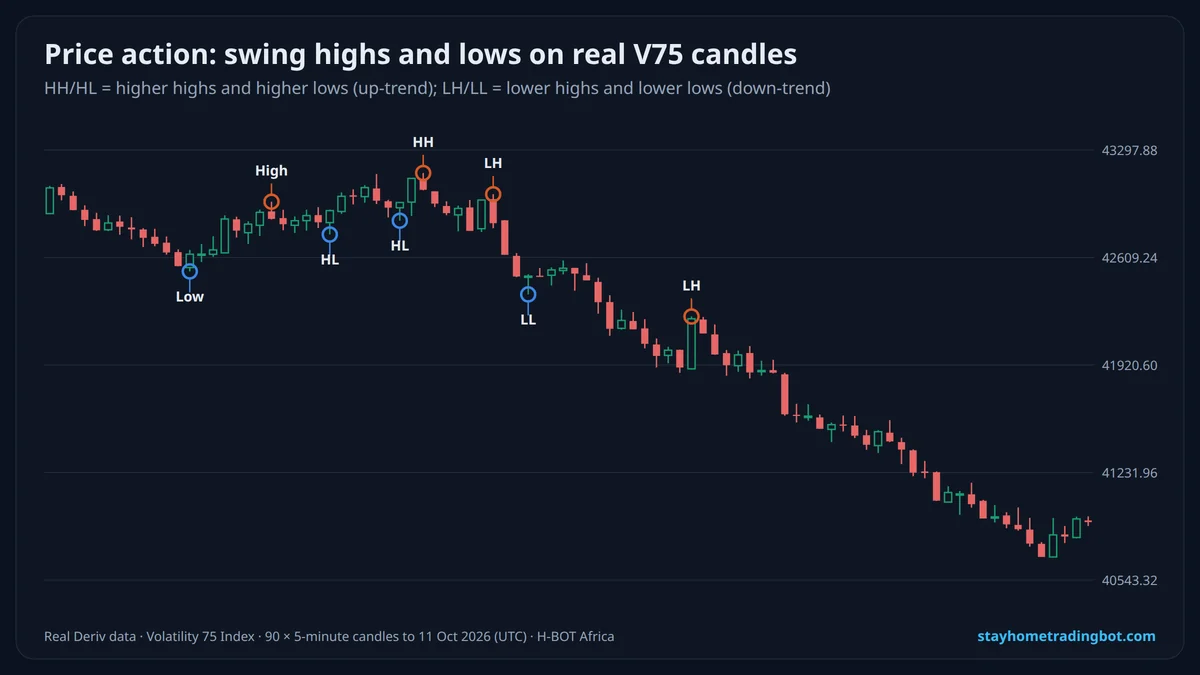
The Three Building Blocks
- Market structure: HH/HL = up-trend, LH/LL = down-trend, no pattern = range.
- Key levels: areas where price turned before (support, resistance, round numbers).
- Candle signals: rejection wicks, engulfing candles and inside bars at those levels.
How to Read Trend Changes
A trend is intact while the pattern holds. In an up-trend, the first lower low (price breaking below the last higher low) is the first warning that buyers are losing control. Wait for a lower high to confirm before trading the other way.
A Price Action Strategy to Test
| Step | Rule |
|---|---|
| 1. Structure | Mark the last 3–4 swings on a 5- or 15-minute chart |
| 2. Direction | Trade only with the structure (buys in HH/HL) |
| 3. Location | Wait for price to pull back to a marked level |
| 4. Trigger | Bullish engulfing or long lower wick at the level |
| 5. Stop | Just beyond the last swing low |
| 6. Target | Previous swing high, or 2× the risk |
Price Action vs Indicators
Indicators are calculated from price, so they lag it. Price action reacts first but needs practice to read. Many traders combine both: price action for location and timing, one indicator such as a moving average as a trend filter.
Related: support and resistance, candlestick patterns and breakout strategy.
Try It Free on a $10,000 Demo
Open a free Deriv account, connect it to H-BOT Africa and test bots, signals and digit tools on virtual money before risking a shilling.
Open a free Deriv account Open Deriv Bot Open H-BOT Ask on WhatsApp
Have an audience? Become a Deriv partner and earn commission on clients you refer.
Disclosure: some links on this page are Deriv partner links. If you open an account or become a partner through them, H-BOT Africa may earn a commission at no extra cost to you.
Frequently Asked Questions
What is price action trading?
Trading from the chart itself: swings, levels and candles, without relying on indicators.
What is the best price action strategy?
Trade with the market structure, enter on pullbacks to levels with a confirming candle, and use a stop beyond the last swing.
What are higher highs and higher lows?
Each peak and dip is higher than the last: the definition of an up-trend.
Does price action work on synthetic indices?
It gives structure to entries and stops, but does not predict random prices; test on demo.
Which timeframe is best for price action?
5- to 15-minute charts are a good start on synthetics.
Do I need indicators for price action?
No, but one trend filter such as a moving average helps many beginners.
Related Guides
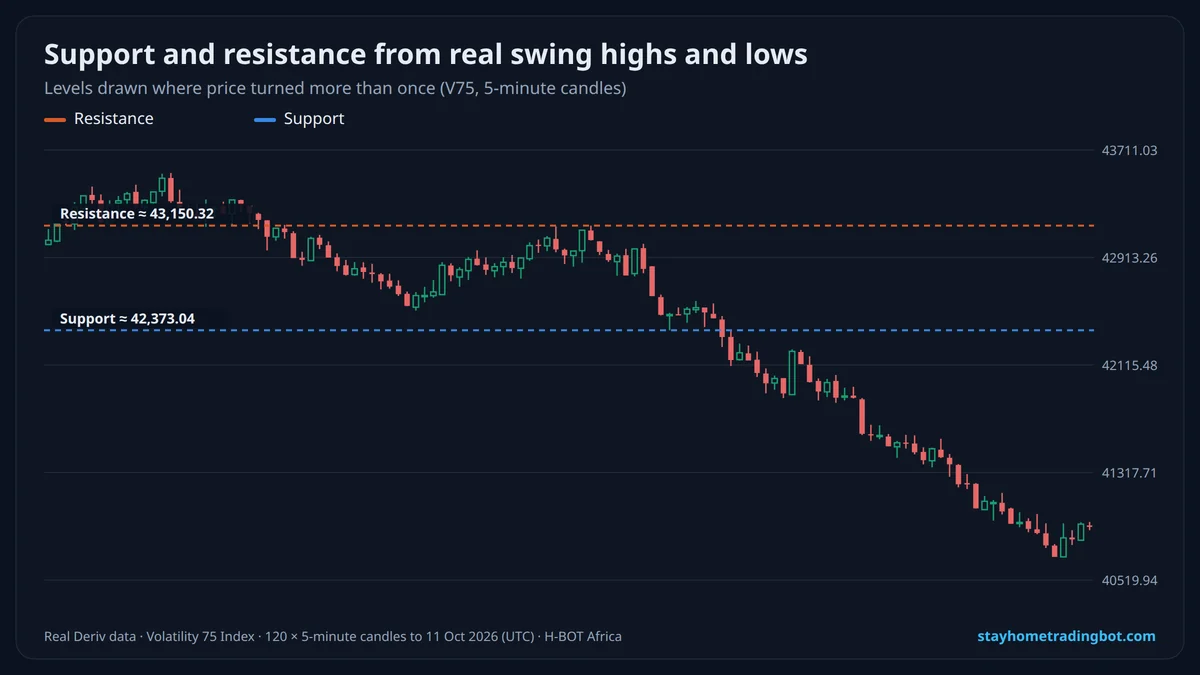 Support and Resistance on Deriv: How to Draw Levels and Trade Them Safely
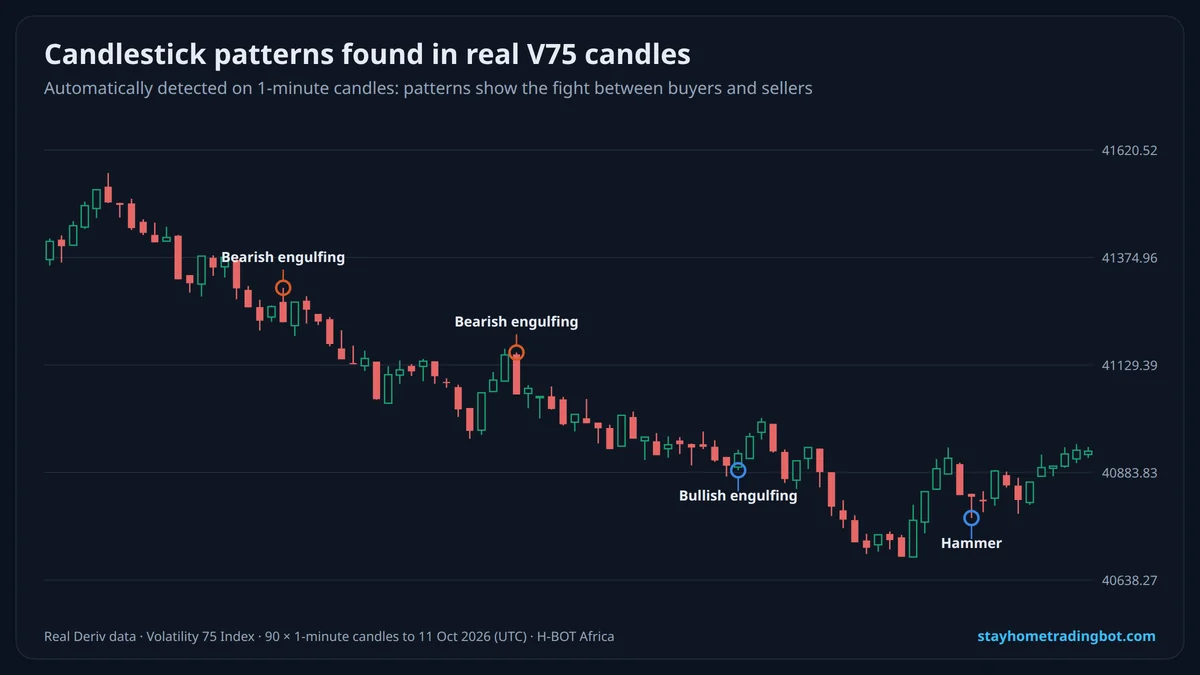 Candlestick Patterns for Deriv Traders: Doji, Hammer, Engulfing and How to Use Them
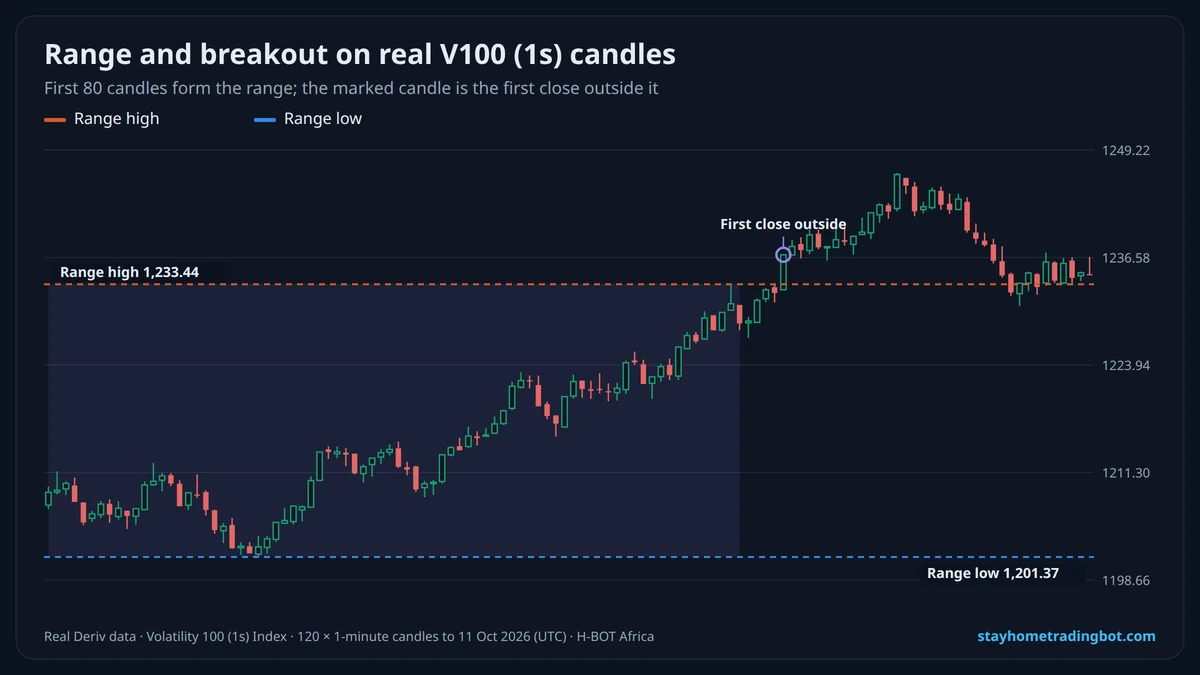 Breakout Strategy for Deriv: Trading Ranges, Trend Lines and Avoiding False Breakouts
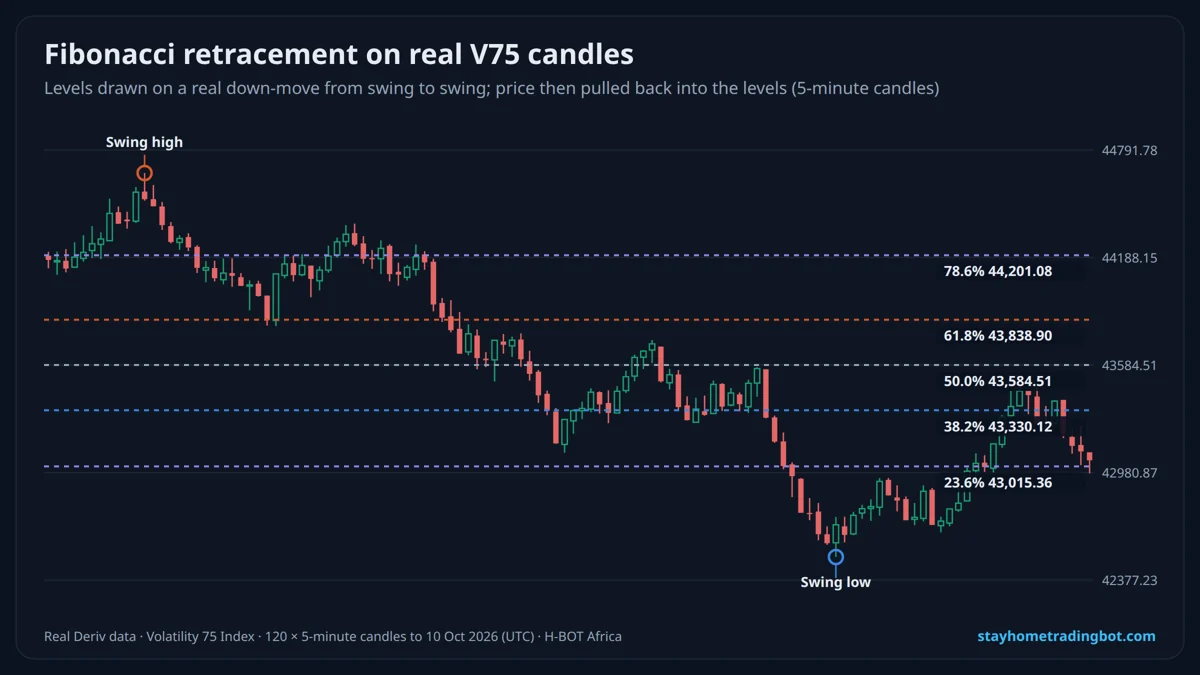 Fibonacci Retracement Strategy for Deriv: How to Draw It and Trade the Levels