Moving Average Strategy for Deriv: Crossovers, Trend Filters and Settings
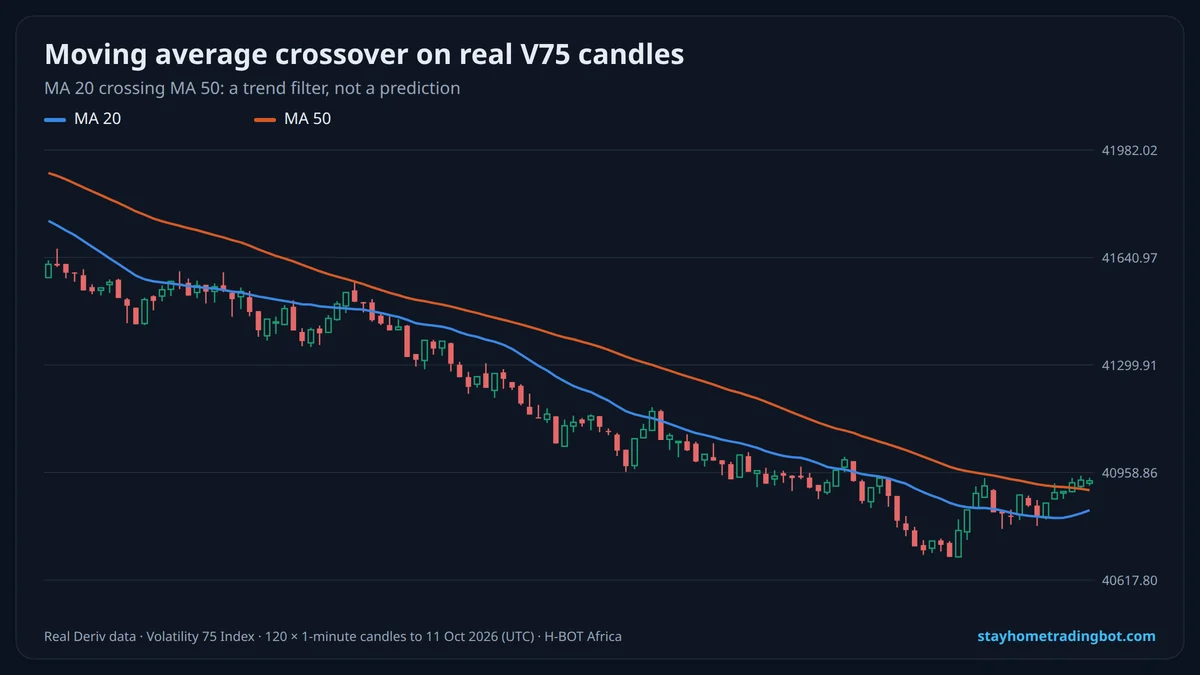
SMA vs EMA
| SMA (simple) | EMA (exponential) | |
|---|---|---|
| Calculation | Equal weight to each candle | More weight to recent candles |
| Speed | Slower | Faster |
| Use | Trend direction | Earlier signals, more noise |
The MA Crossover Strategy
- Fast MA (e.g. 20) crosses above slow MA (e.g. 50): bullish bias.
- Fast MA crosses below slow MA: bearish bias.
- Enter on a pullback toward the fast MA, not on the cross candle itself.
- Exit when price closes back across the slow MA or at your target.
Using an MA as a Trend Filter
The simplest use: only take Rise trades when price is above the MA 50 and the MA is rising; only Fall trades when price is below a falling MA 50. Add RSI for timing.
Weakness: Sideways Markets
In ranges, MAs cross back and forth and produce many losing signals. Skip trades when the MAs are flat and tangled.
Demo Test Plan
| Rule | Example |
|---|---|
| Chart | V75, 1-minute |
| Filter | MA 20 above MA 50 |
| Entry | Pullback to MA 20 with an up candle |
| Stake | Fixed 1–2% |
| Sample | 50 trades before judging |
A Demo Practice Plan (One Week)
- Day 1: plot MA 20 and MA 50 on V75 and mark the trend each hour.
- Day 2–4: take pullback entries in the trend only.
- Day 5: compare SMA vs EMA versions.
- Day 6–7: write the rules you will keep.
Common Mistakes
- Trading every crossover in a range.
- Entering late after a long move.
- Using too many moving averages.
Try It Free on a $10,000 Demo
Open a free Deriv account, connect it to H-BOT Africa and test bots, signals and digit tools on virtual money before risking a shilling.
Open a free Deriv account Open Deriv Bot Open H-BOT Ask on WhatsApp
Have an audience? Become a Deriv partner and earn commission on clients you refer.
Disclosure: some links on this page are Deriv partner links. If you open an account or become a partner through them, H-BOT Africa may earn a commission at no extra cost to you.
Frequently Asked Questions
What is the best moving average for Deriv?
MA 20 and MA 50 are common; there is no best value, only one that fits your timeframe.
Is EMA better than SMA?
EMA reacts faster; SMA is smoother. Test both.
Does the MA crossover work on synthetic indices?
It shows trends after they start; in ranges it gives many false signals.
What timeframe is best for moving averages?
1–15 minutes for intraday synthetic trading.
Can I use moving averages in a bot?
Yes, indicator blocks can check MA conditions; test on demo.
Why do moving averages lag?
They average past prices, so they always react after price moves.
Related Guides
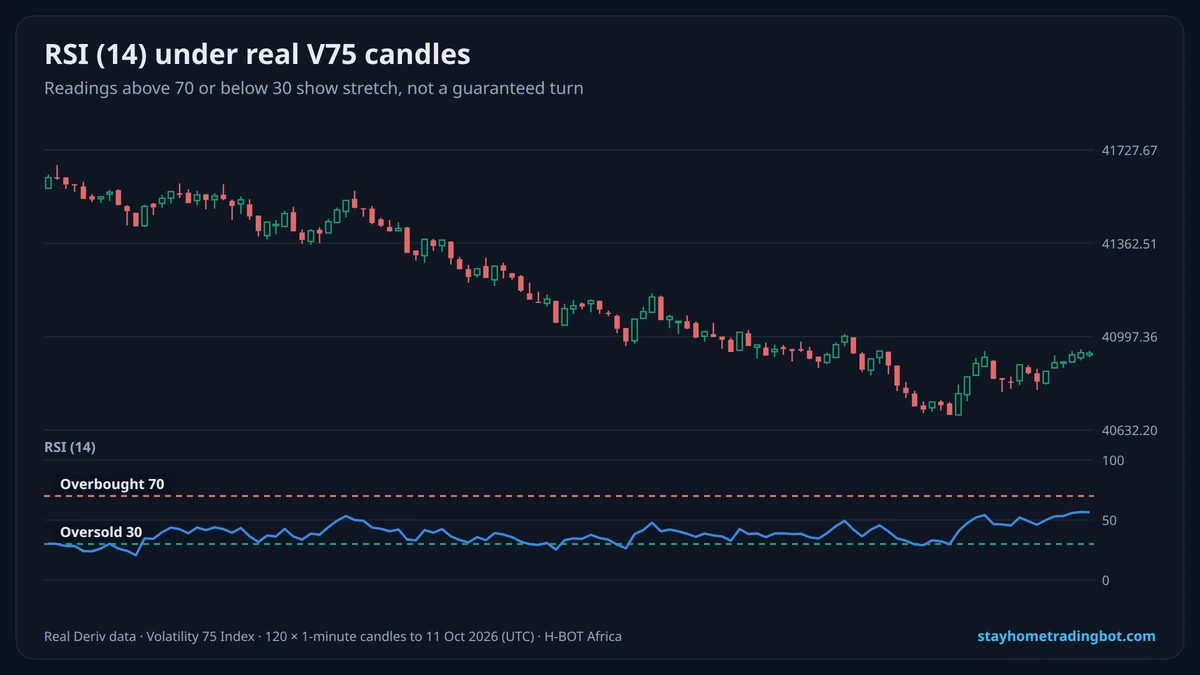 RSI Strategy for Deriv Synthetic Indices: Settings, Signals and What Real Data Shows
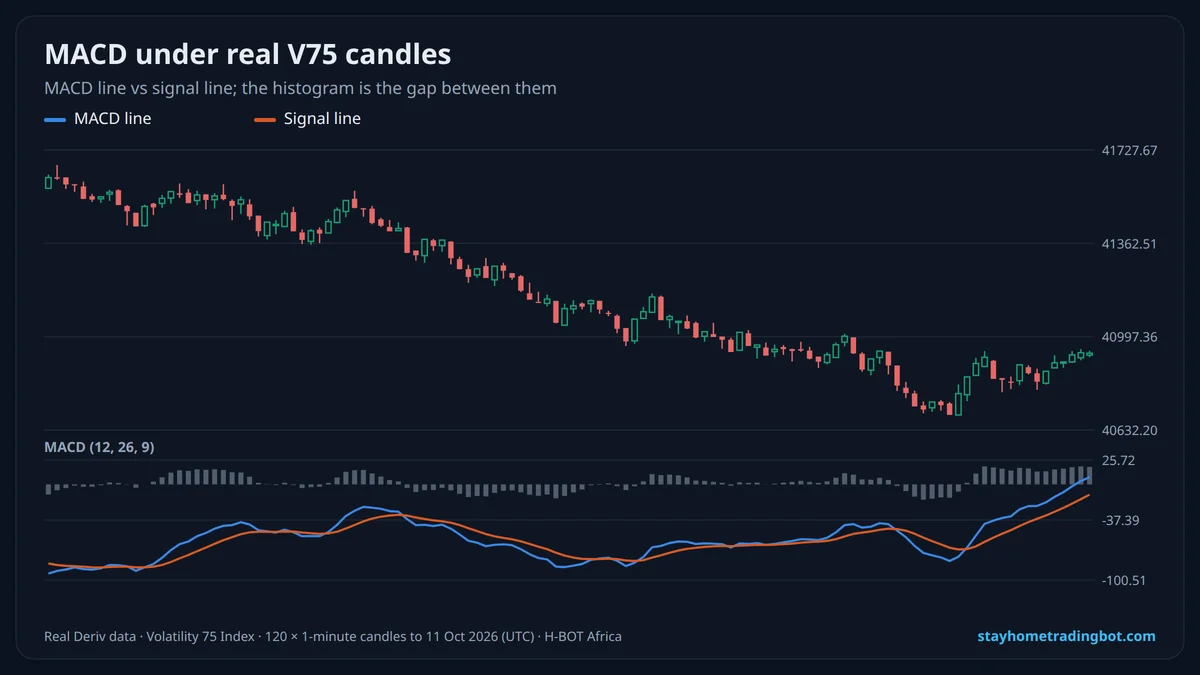 MACD Strategy for Deriv: Signal Line Crosses, Histogram and Divergence
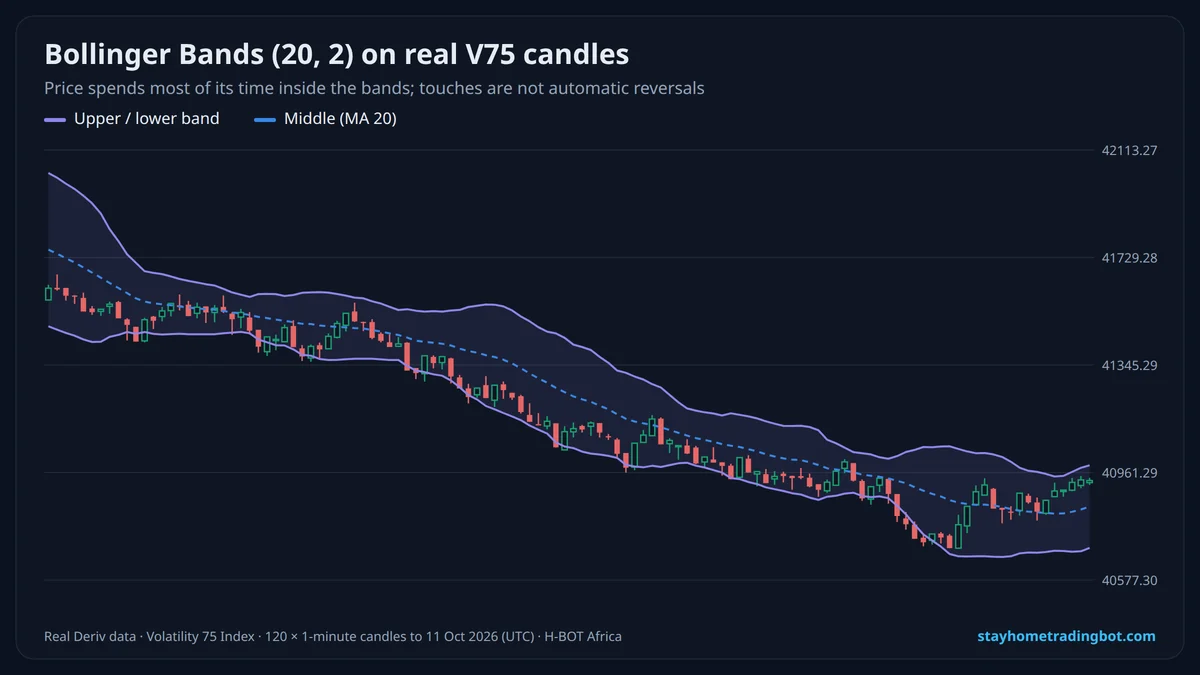 Bollinger Bands Strategy for Deriv: Squeeze, Band Walk and Mean ReversionDeriv Rise/Fall Strategy: How the Contract Works and How to Trade It Carefully