Bollinger Bands Strategy for Deriv: Squeeze, Band Walk and Mean Reversion
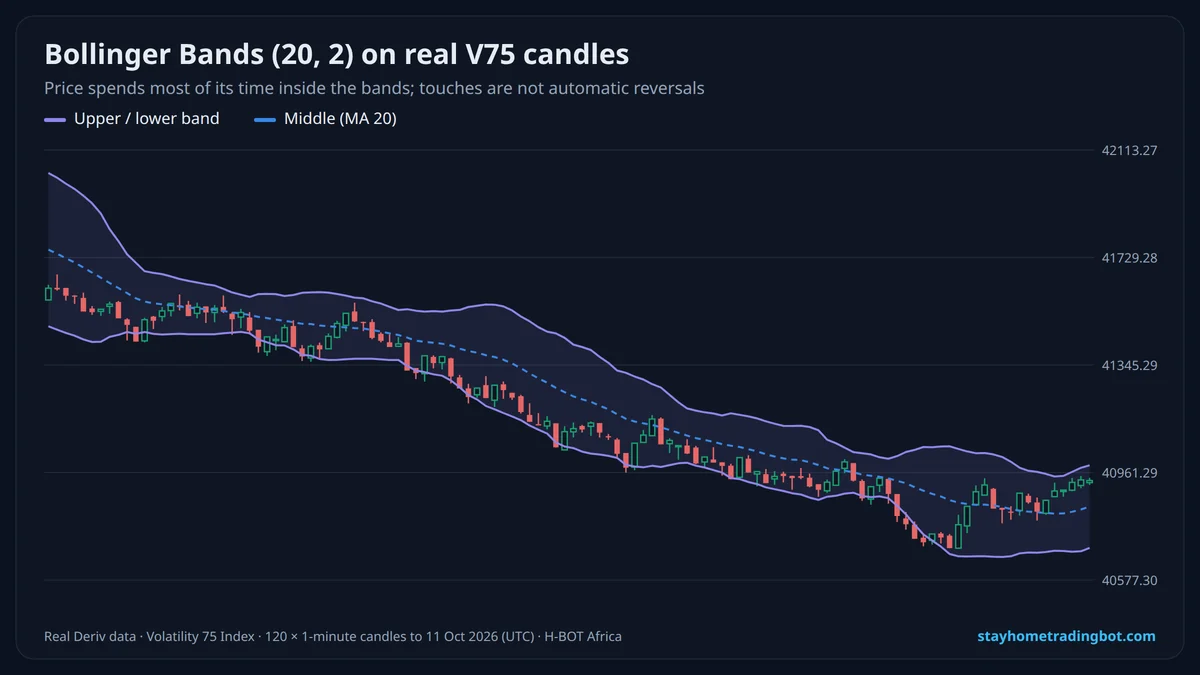
Three Bollinger Band Setups
| Setup | Market | Idea |
|---|---|---|
| Bounce (mean reversion) | Sideways range | Fade touches of the outer band back toward the middle |
| Squeeze breakout | After a quiet period | Trade the direction of the first strong close outside the bands |
| Band walk | Strong trend | Stay with the trend while price hugs one band |
Bollinger Bands + RSI
A touch of the lower band with RSI below 30 in a range is a stronger bounce signal than either alone. In a down-trend, both can stay low for a long time, so check the trend first.
Settings
20, 2 is standard. 20, 2.5 gives fewer touches; 10, 1.5 suits very short trades but is noisier.
Mistakes
- Selling every upper-band touch in an up-trend.
- Ignoring the squeeze breakout direction.
- No stop beyond the band.
A Demo Practice Plan (One Week)
- Day 1: label ranges and trends on a V75 chart with Bollinger Bands.
- Day 2–3: in ranges, test band-touch bounces with RSI confirmation.
- Day 4–5: in squeezes, test breakout entries after a close outside the band.
- Day 6–7: review which setup suited the index you trade.
Common Mistakes
- Fading the band in a strong trend.
- Using the bands without a stop-loss.
- Changing settings every day.
Try It Free on a $10,000 Demo
Open a free Deriv account, connect it to H-BOT Africa and test bots, signals and digit tools on virtual money before risking a shilling.
Open a free Deriv account Open Deriv Bot Open H-BOT Ask on WhatsApp
Have an audience? Become a Deriv partner and earn commission on clients you refer.
Disclosure: some links on this page are Deriv partner links. If you open an account or become a partner through them, H-BOT Africa may earn a commission at no extra cost to you.
Frequently Asked Questions
What are the best Bollinger Band settings?
20 periods and 2 standard deviations is the standard.
What is a Bollinger Band squeeze?
When the bands narrow after a quiet period; a bigger move often follows.
Does touching the upper band mean sell?
Not in a trend; price can walk along the band.
Do Bollinger Bands work on Volatility 75?
They describe volatility well; they do not predict direction.
Should I combine Bollinger Bands with RSI?
Many traders do, especially in ranges.
Which timeframe suits Bollinger Bands?
1–15 minutes on synthetic indices.
Related Guides
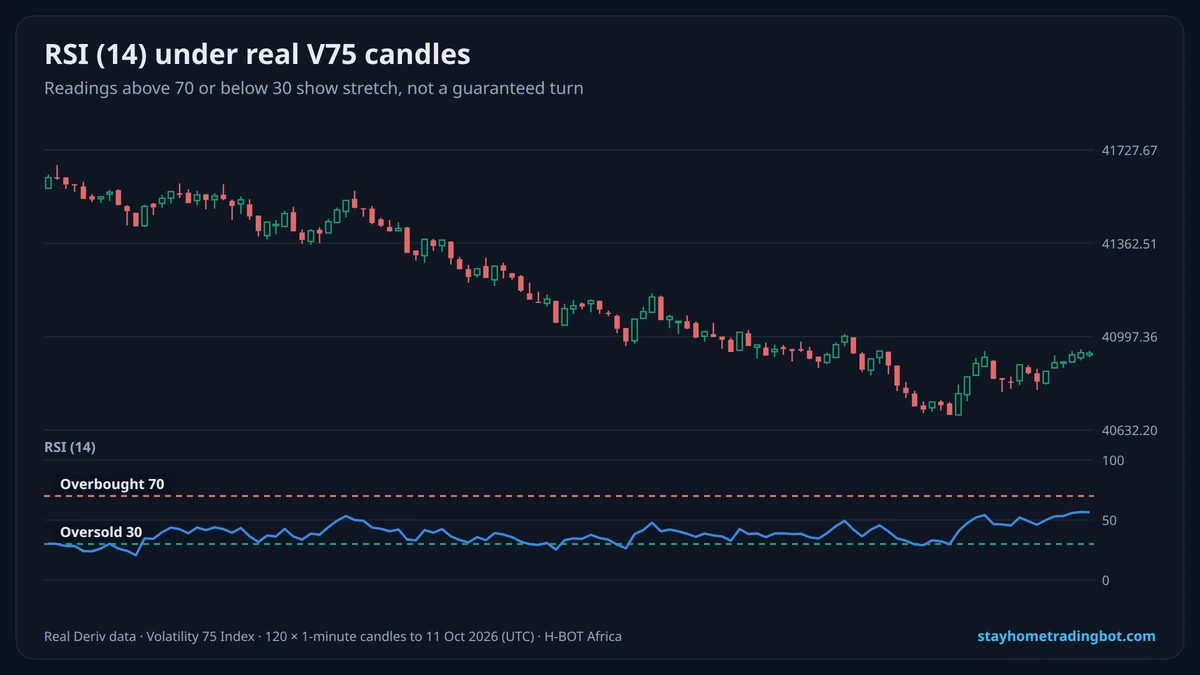 RSI Strategy for Deriv Synthetic Indices: Settings, Signals and What Real Data Shows
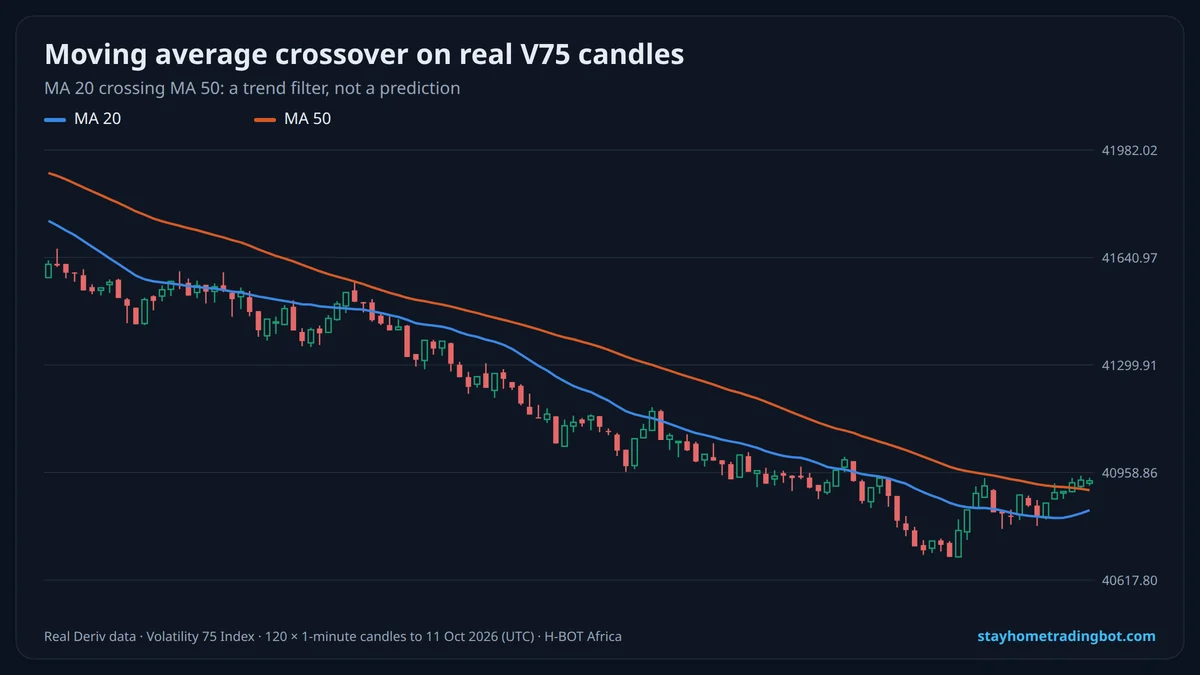 Moving Average Strategy for Deriv: Crossovers, Trend Filters and Settings
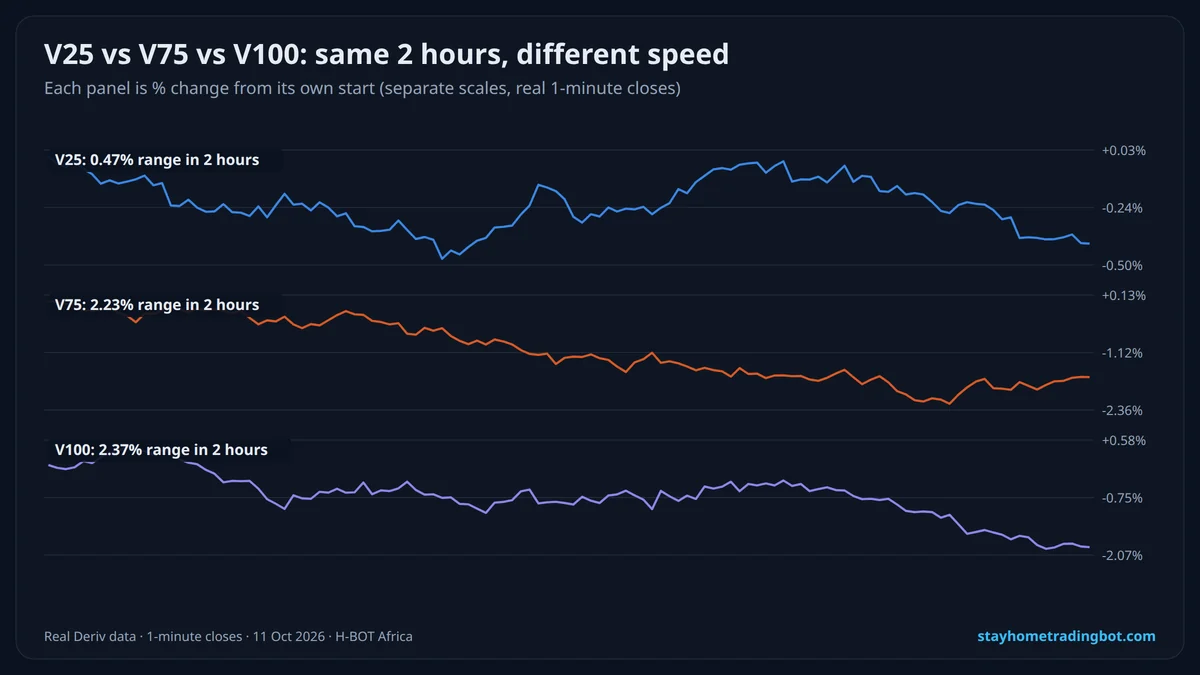 Volatility 75 Index (V75): What It Is, How It Works and How to Trade ItBest Indicators for Deriv Synthetic Indices: Which to Use and How to Combine Them