RSI Strategy for Deriv Synthetic Indices: Settings, Signals and What Real Data Shows
How the RSI Indicator Works
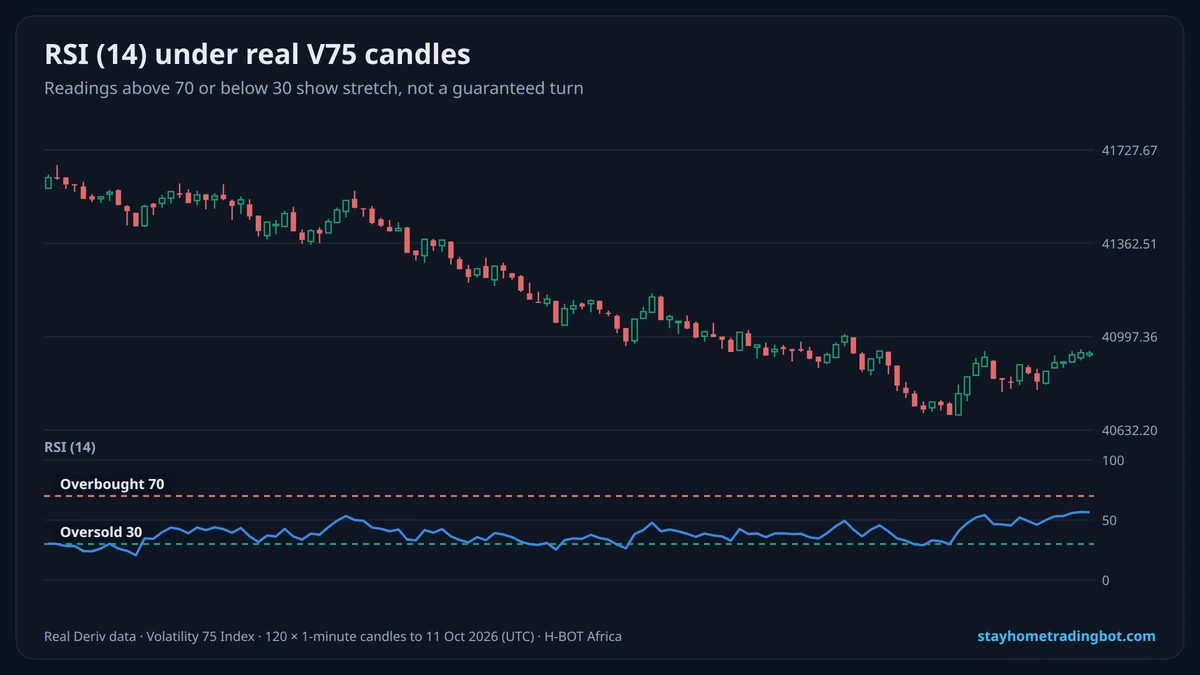
RSI compares the size of recent up-moves with recent down-moves. When most candles close higher, RSI rises toward 100; when most close lower, it falls toward 0. The classic setting is 14 periods, with 70 and 30 as the overbought and oversold levels.
Best RSI Settings for Deriv
| Setting | Effect | Use when |
|---|---|---|
| RSI 14, 70/30 | Balanced, fewer signals | Default for 1–15 minute charts |
| RSI 7, 80/20 | Faster, more signals and more noise | Short tick or 1-minute trades |
| RSI 21, 65/35 | Slower, smoother | 5–15 minute trend trades |
Three RSI Signals Traders Use
- Overbought/oversold: look for Fall below 70 after a move above it, or Rise above 30 after a move below it.
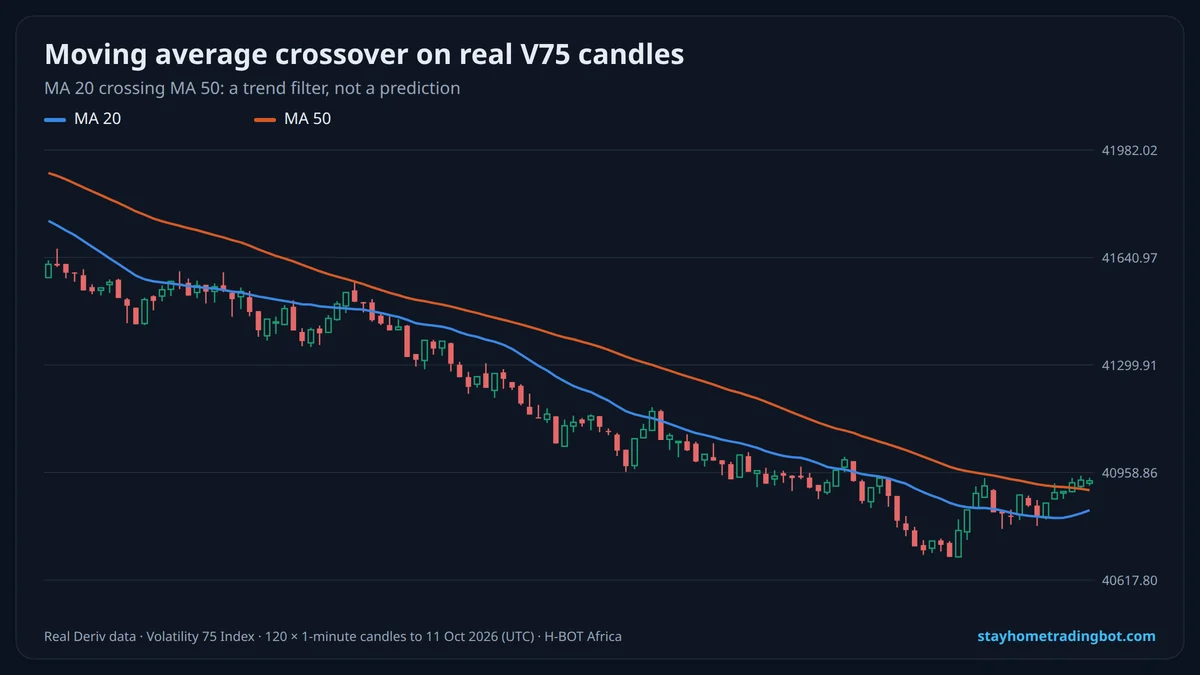
- Trend filter: in an up-trend (price above its 50 moving average) only take Rise signals when RSI dips toward 40–50.
- Divergence: price makes a new high but RSI makes a lower high, a sign the move is losing strength.
Why RSI Alone Is Not Enough on Synthetic Indices
Volatility indices are generated by a random number generator, so "oversold" can stay oversold. In strong trends RSI stays above 70 or below 30 for long periods. Combine RSI with a moving average trend filter and support and resistance, and always use a stop.
An RSI Plan to Test on Demo
| Rule | Example |
|---|---|
| Market | Volatility 75 or 100, 1-minute chart |
| Trend filter | Price above MA 50 = only Rise trades |
| Entry | RSI crosses back above 40 from below |
| Stake | 1–2% of balance, fixed |
| Stop | Daily loss limit 10%; stop after 3 losses in a row |
Log 50 demo trades in the H-BOT journal before using real money.
Try It Free on a $10,000 Demo
Open a free Deriv account, connect it to H-BOT Africa and test bots, signals and digit tools on virtual money before risking a shilling.
Open a free Deriv account Open Deriv Bot Open H-BOT Ask on WhatsApp
Have an audience? Become a Deriv partner and earn commission on clients you refer.
Disclosure: some links on this page are Deriv partner links. If you open an account or become a partner through them, H-BOT Africa may earn a commission at no extra cost to you.
Frequently Asked Questions
What is the best RSI setting for Deriv?
RSI 14 with 70/30 levels is the standard; shorter settings give more signals and more noise.
Does RSI work on Volatility 75?
It shows stretched moves, but it does not predict random synthetic indices. Use it as a filter with a stop-loss.
What does RSI above 70 mean?
Recent buying has been strong (overbought). It is not a guarantee that price will fall.
What is RSI divergence?
When price makes a new high or low but RSI does not, suggesting the move is weakening.
Can I use RSI in a Deriv bot?
Yes. Deriv Bot and H-BOT tools can use indicator conditions; test any rule on demo first.
Which timeframe is best for RSI?
1–15 minute charts are common on synthetics; longer timeframes give fewer, slower signals.
Related Guides
 Moving Average Strategy for Deriv: Crossovers, Trend Filters and Settings
 Bollinger Bands Strategy for Deriv: Squeeze, Band Walk and Mean Reversion
 Best Indicators for Deriv Synthetic Indices: Which to Use and How to Combine Them
 Risk Management for Deriv Traders: Stake Size, Stop-Loss and Daily Limits That Protect Your Account