Support and Resistance on Deriv: How to Draw Levels and Trade Them Safely
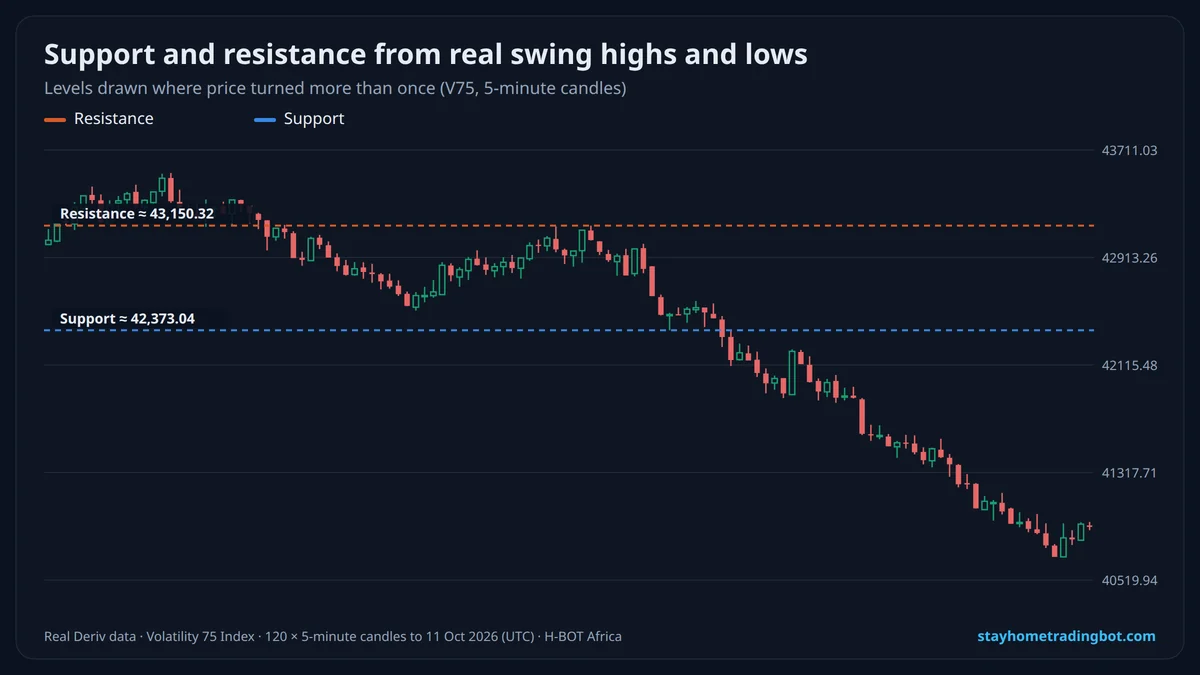
How to Draw Support and Resistance
- Open a 5-minute or 15-minute chart and zoom out to see a few hours.
- Mark obvious swing highs (peaks) and swing lows (troughs).
- Draw a horizontal zone where price turned at least twice.
- Keep 2–3 levels near current price; delete the rest.
Two Ways to Trade a Level
| Approach | Entry | Stop | Risk |
|---|---|---|---|
| Bounce | Price touches support and a rejection candle forms | Just below support | Level breaks |
| Breakout | A candle closes beyond the level, then retests it | Back inside the range | False breakout |
Using Candles to Confirm
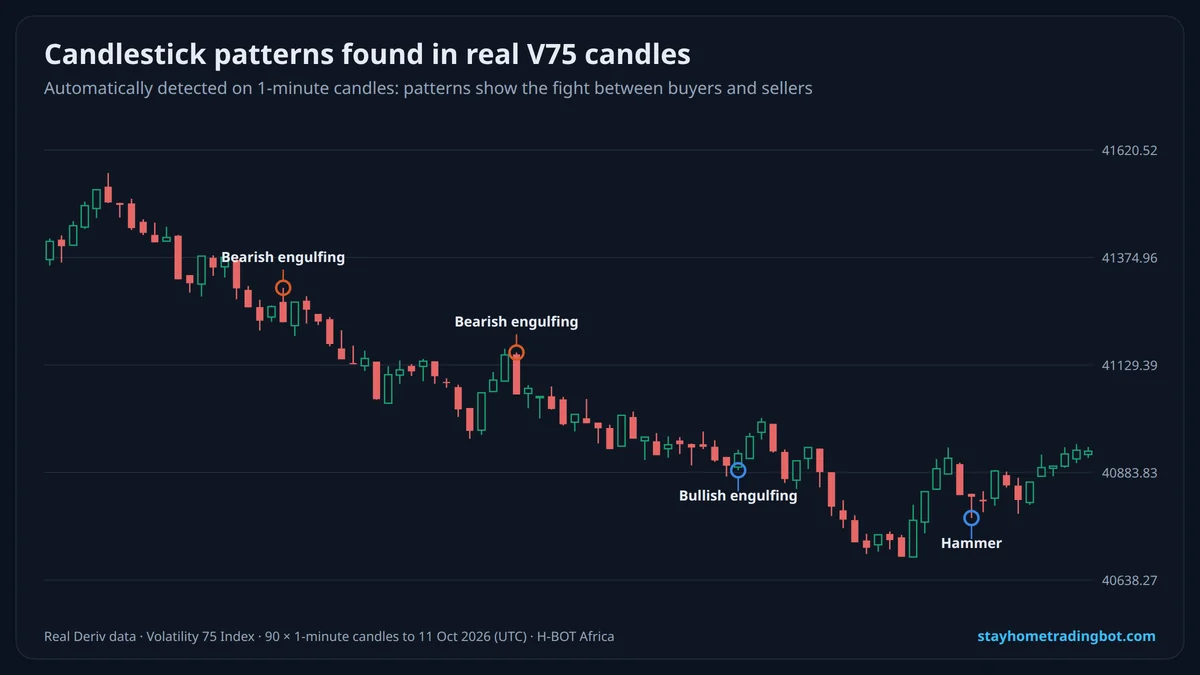
A hammer or bullish engulfing at support, or a shooting star or bearish engulfing at resistance, adds confirmation. See candlestick patterns.
Common Mistakes
- Drawing too many lines.
- Treating a level as an exact price.
- Entering before the candle closes.
- No stop because "it always bounces here".
Support and Resistance With Options
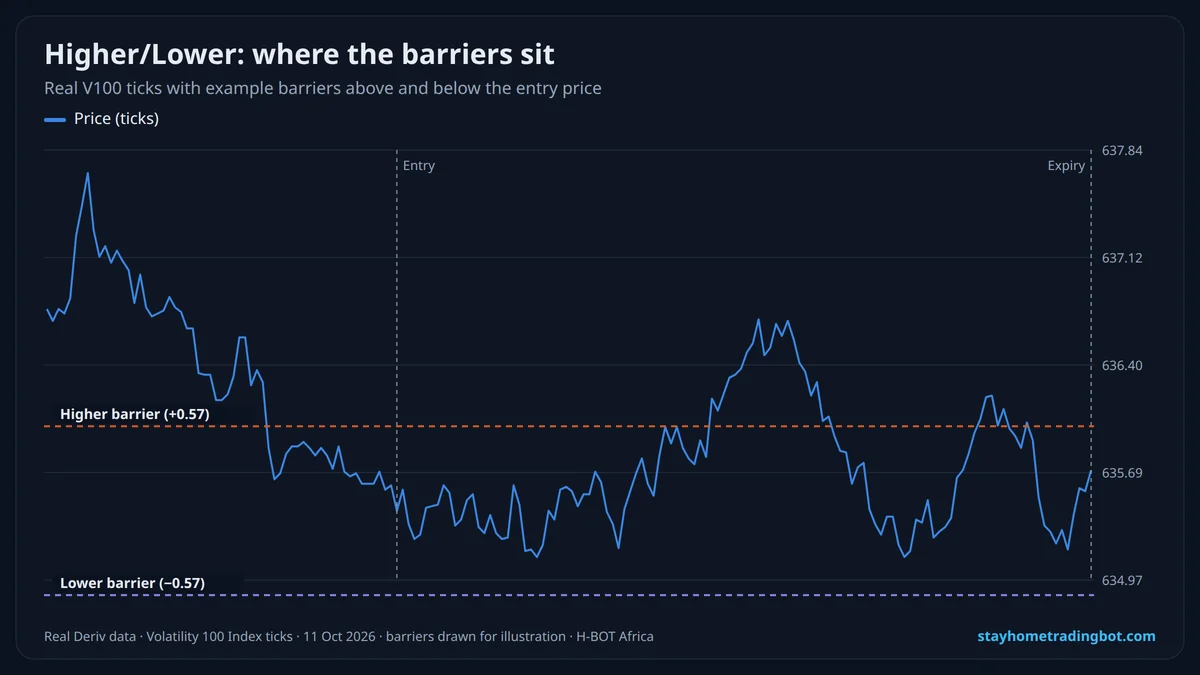
For Rise/Fall or Higher/Lower, levels help choose direction and barriers. See Higher/Lower and Touch/No Touch.
A Demo Practice Plan (One Week)
- Day 1: draw levels on V75 5-minute charts for the last day.
- Day 2–4: wait for price to reach a level and trade only with a confirming candle.
- Day 5: compare bounce vs breakout results.
- Day 6–7: refine where you place stops.
Common Mistakes
- Drawing a line through every wick.
- Stops exactly on the level.
- Trading in the middle of the range.
Try It Free on a $10,000 Demo
Open a free Deriv account, connect it to H-BOT Africa and test bots, signals and digit tools on virtual money before risking a shilling.
Open a free Deriv account Open Deriv Bot Open H-BOT Ask on WhatsApp
Have an audience? Become a Deriv partner and earn commission on clients you refer.
Disclosure: some links on this page are Deriv partner links. If you open an account or become a partner through them, H-BOT Africa may earn a commission at no extra cost to you.
Frequently Asked Questions
How do I find support and resistance?
Mark swing highs and lows where price turned at least twice and draw zones there.
Which timeframe is best for support and resistance?
5–15 minutes for intraday trades; higher timeframes give stronger levels.
Does support and resistance work on synthetic indices?
Traders use them on synthetics, but price is random; use stops and confirmation.
What is a breakout?
When a candle closes beyond a level; safer entries often wait for a retest.
Where should I place my stop?
Just beyond the level, outside the zone.
How many levels should I draw?
Two or three near current price are enough.
Related Guides
 Candlestick Patterns for Deriv Traders: Doji, Hammer, Engulfing and How to Use Them
 RSI Strategy for Deriv Synthetic Indices: Settings, Signals and What Real Data Shows
 Deriv Higher/Lower: How Barriers Work and How to Choose Them
 Risk Management for Deriv Traders: Stake Size, Stop-Loss and Daily Limits That Protect Your Account