Candlestick Patterns for Deriv Traders: Doji, Hammer, Engulfing and How to Use Them
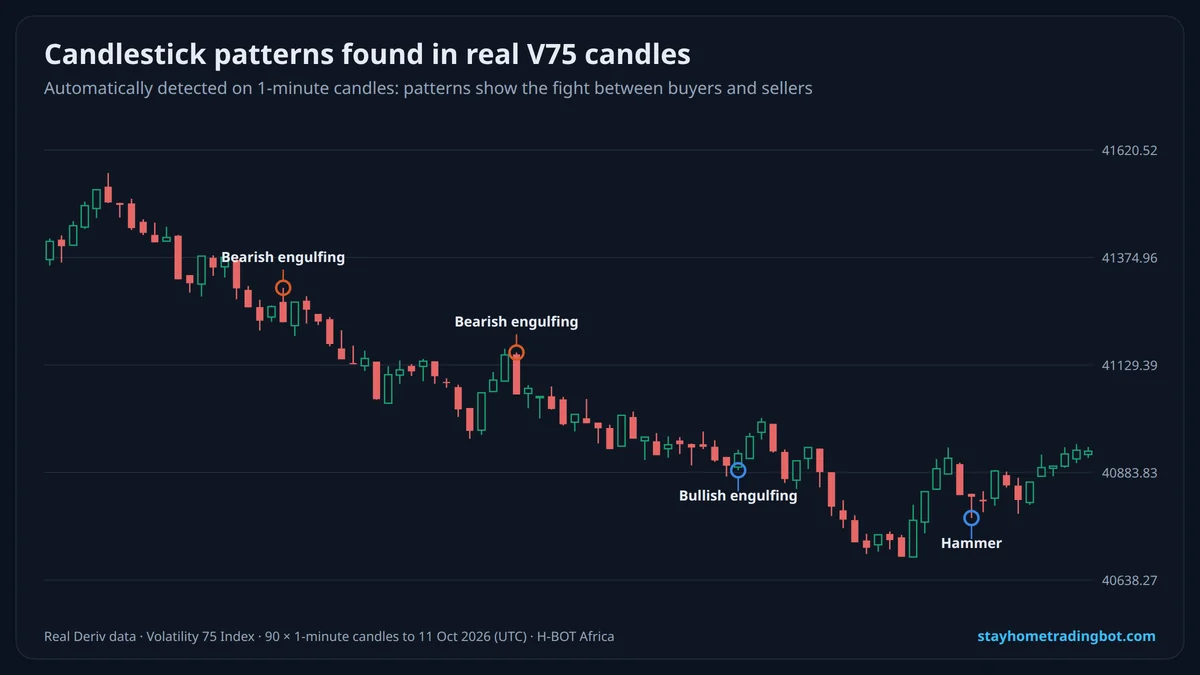
How to Read a Candlestick
| Part | Meaning |
|---|---|
| Body | Distance between open and close |
| Hollow / green body | Closed higher than it opened |
| Filled / red body | Closed lower than it opened |
| Upper wick | Highest price reached |
| Lower wick | Lowest price reached |
Key Patterns
| Pattern | Looks like | Suggests |
|---|---|---|
| Doji | Tiny body, wicks both sides | Indecision |
| Hammer | Small body at top, long lower wick | Buyers rejected lower prices |
| Shooting star | Small body at bottom, long upper wick | Sellers rejected higher prices |
| Bullish engulfing | Up candle body covers previous down body | Buyers took control |
| Bearish engulfing | Down candle body covers previous up body | Sellers took control |
| Morning / evening star | Three-candle turn | Possible reversal |
How to Use Patterns Safely
- Wait for the candle to close.
- Only act at a marked level (support or resistance).
- Check the trend (moving averages).
- Set the stop beyond the pattern’s wick.
Patterns on Tick Charts
On very short durations (a few ticks), candle patterns have little meaning. They work better on 1-minute and higher charts.
A Demo Practice Plan (One Week)
- Day 1: find 10 hammers and 10 engulfing patterns on V75 1-minute history.
- Day 2–4: trade patterns only at marked levels.
- Day 5: compare with patterns in the middle of ranges.
- Day 6–7: keep the two patterns that worked best for you.
Common Mistakes
- Trading patterns on tick charts.
- Acting before the candle closes.
- Ignoring the trend.
Try It Free on a $10,000 Demo
Open a free Deriv account, connect it to H-BOT Africa and test bots, signals and digit tools on virtual money before risking a shilling.
Open a free Deriv account Open Deriv Bot Open H-BOT Ask on WhatsApp
Have an audience? Become a Deriv partner and earn commission on clients you refer.
Disclosure: some links on this page are Deriv partner links. If you open an account or become a partner through them, H-BOT Africa may earn a commission at no extra cost to you.
Frequently Asked Questions
What are candlestick patterns?
Shapes of one to three candles that show the balance between buyers and sellers.
Which candlestick pattern is most reliable?
No pattern is reliable alone; engulfing and hammer patterns at strong levels are commonly used.
Do candlestick patterns work on synthetic indices?
They describe price action, but synthetics are random; combine with levels and stops.
What does a doji mean?
Indecision: open and close are almost equal.
What timeframe is best for candlestick patterns?
1-minute and higher; tick charts are too noisy.
How do I learn candlestick patterns?
Mark them on demo charts for a week and note what happened next.
Related Guides
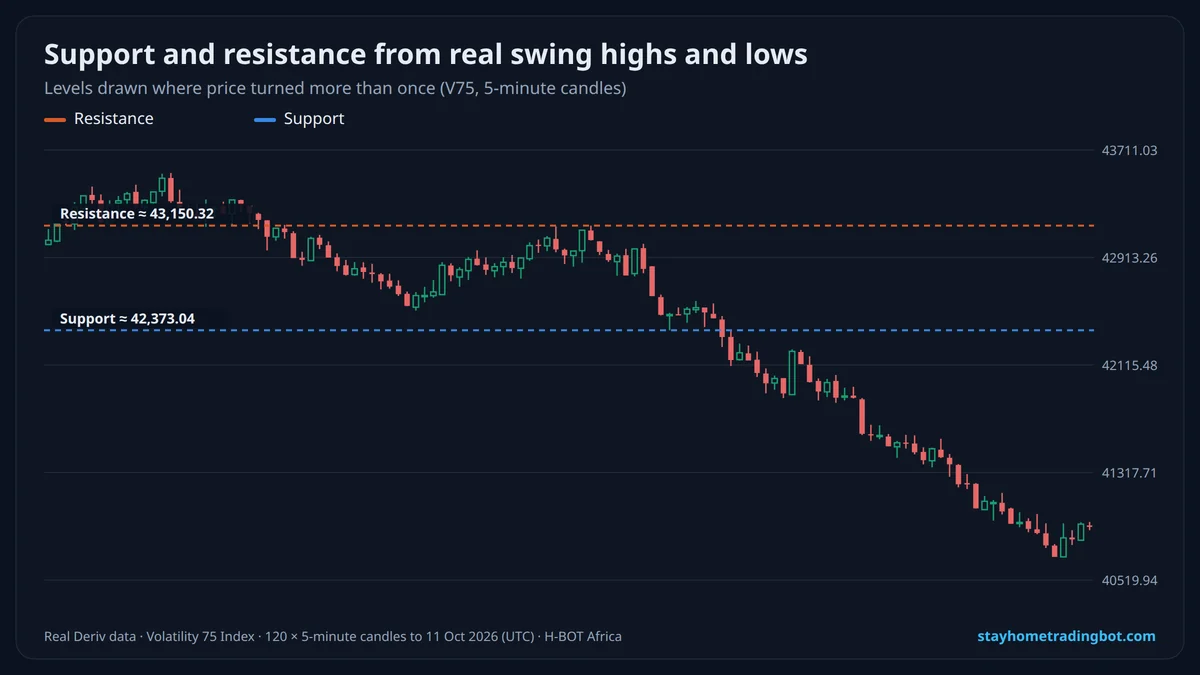 Support and Resistance on Deriv: How to Draw Levels and Trade Them Safely
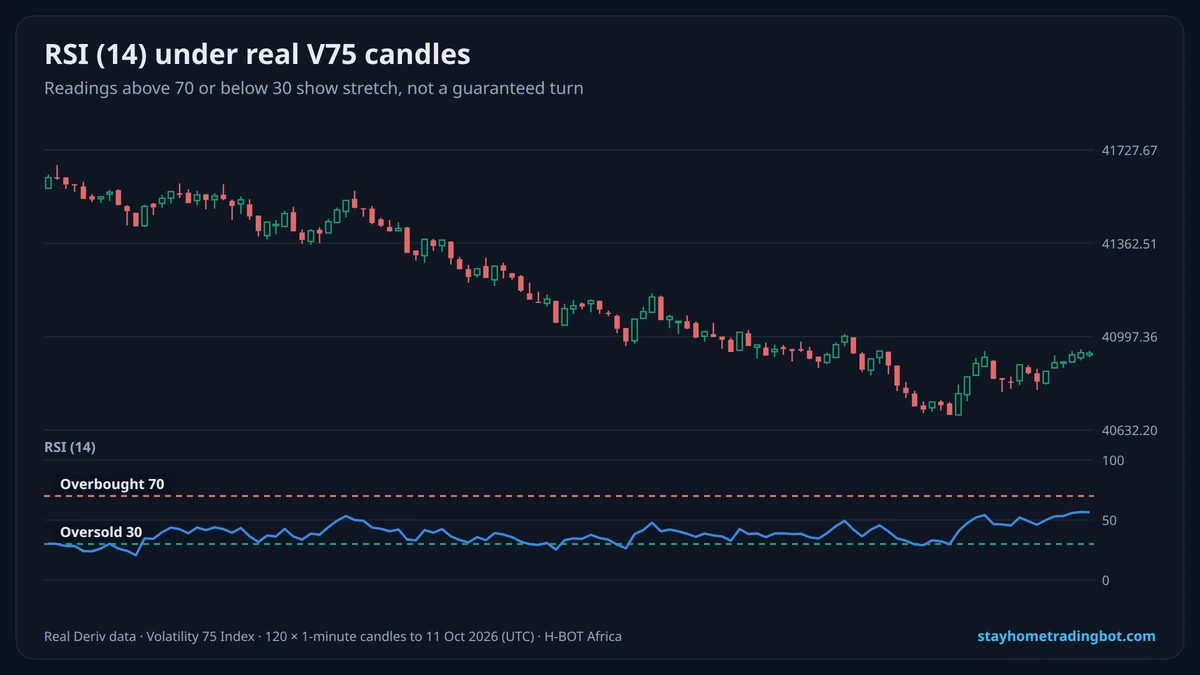 RSI Strategy for Deriv Synthetic Indices: Settings, Signals and What Real Data ShowsH-BOT Advanced KE Chart and AI Chart: How to Read Levels and Use Them Safely
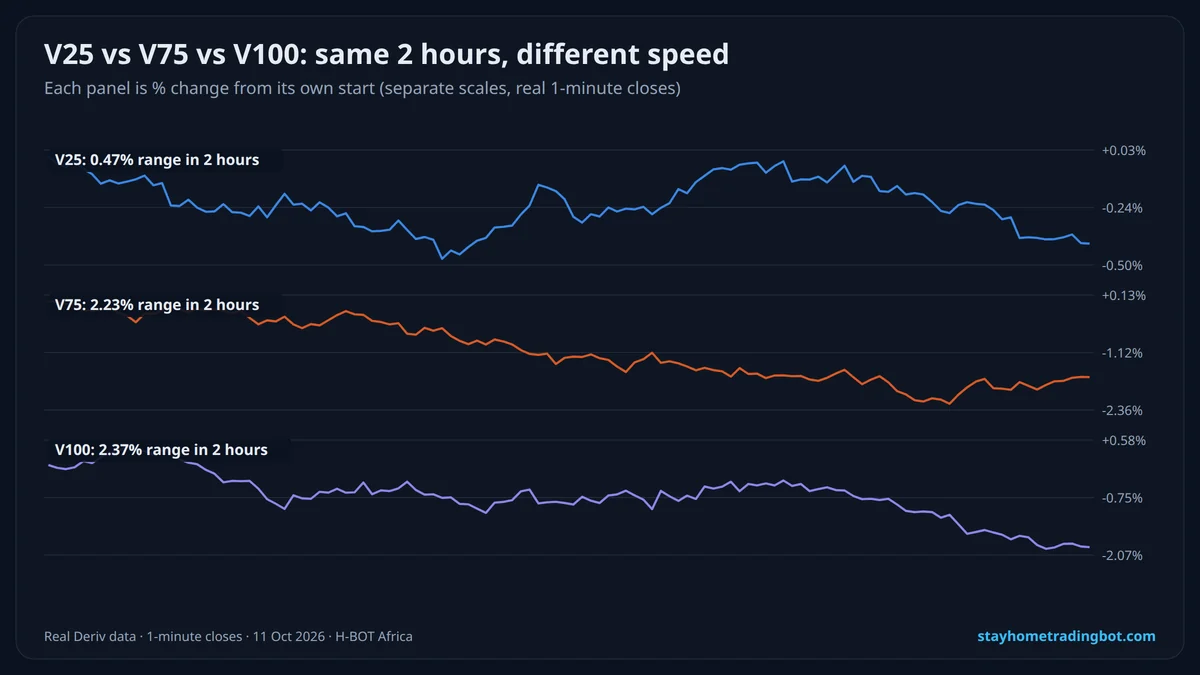 Best Indicators for Deriv Synthetic Indices: Which to Use and How to Combine Them