MACD Strategy for Deriv: Signal Line Crosses, Histogram and Divergence
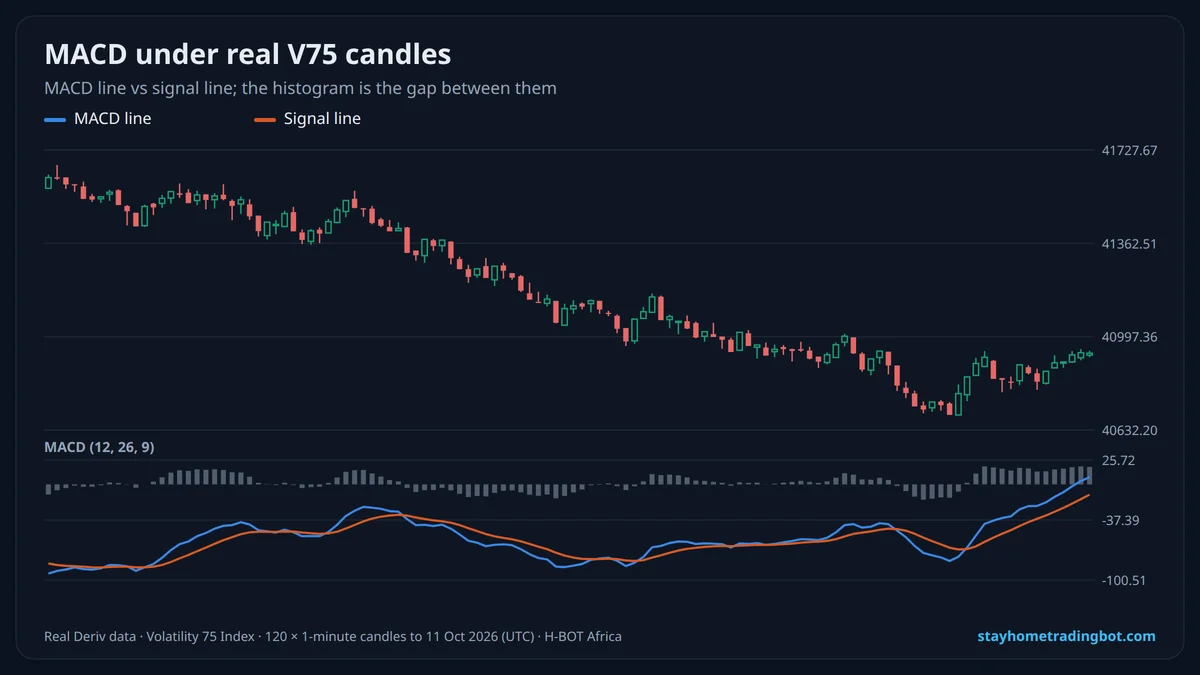
MACD Parts
| Part | What it is |
|---|---|
| MACD line | EMA 12 minus EMA 26 |
| Signal line | EMA 9 of the MACD line |
| Histogram | MACD minus signal |
| Zero line | Where EMA 12 equals EMA 26 |
Four MACD Signals
- Signal cross: MACD crosses above/below the signal line.
- Zero cross: MACD moves above/below zero (trend change).
- Histogram shrinking: momentum fading.
- Divergence: price new high, MACD lower high.
A MACD + Trend Plan
Trade only in the direction of the MA 50 trend; enter on a MACD signal cross in that direction; stop beyond the last swing. Skip signals when the histogram is tiny and flat.
Settings
12/26/9 is standard. Faster settings (e.g. 6/13/5) give earlier but noisier signals on 1-minute charts.
A Demo Practice Plan (One Week)
- Day 1: add MACD (12, 26, 9) to a V75 1-minute demo chart and mark the last 20 signal crosses.
- Day 2–4: trade only crosses in the direction of the MA 50 trend, fixed stake.
- Day 5: compare crosses with and without the trend filter.
- Day 6–7: keep the version with the better journal results.
Common Mistakes
- Trading every cross in a sideways market.
- Entering on the cross candle before it closes.
- Ignoring divergence near strong levels.
Try It Free on a $10,000 Demo
Open a free Deriv account, connect it to H-BOT Africa and test bots, signals and digit tools on virtual money before risking a shilling.
Open a free Deriv account Open Deriv Bot Open H-BOT Ask on WhatsApp
Have an audience? Become a Deriv partner and earn commission on clients you refer.
Disclosure: some links on this page are Deriv partner links. If you open an account or become a partner through them, H-BOT Africa may earn a commission at no extra cost to you.
Frequently Asked Questions
What are the best MACD settings?
12, 26, 9 is the standard; faster settings add noise.
What does a MACD crossover mean?
Momentum is shifting in the direction of the cross.
Is MACD good for synthetic indices?
It can confirm momentum, but it lags and cannot predict random moves.
What is the MACD histogram?
The difference between the MACD line and the signal line.
Should I use MACD or RSI?
They measure different things; many traders use one trend tool and one momentum tool.
Can MACD be used in Deriv Bot?
Yes, as an indicator condition; test on demo.
Related Guides
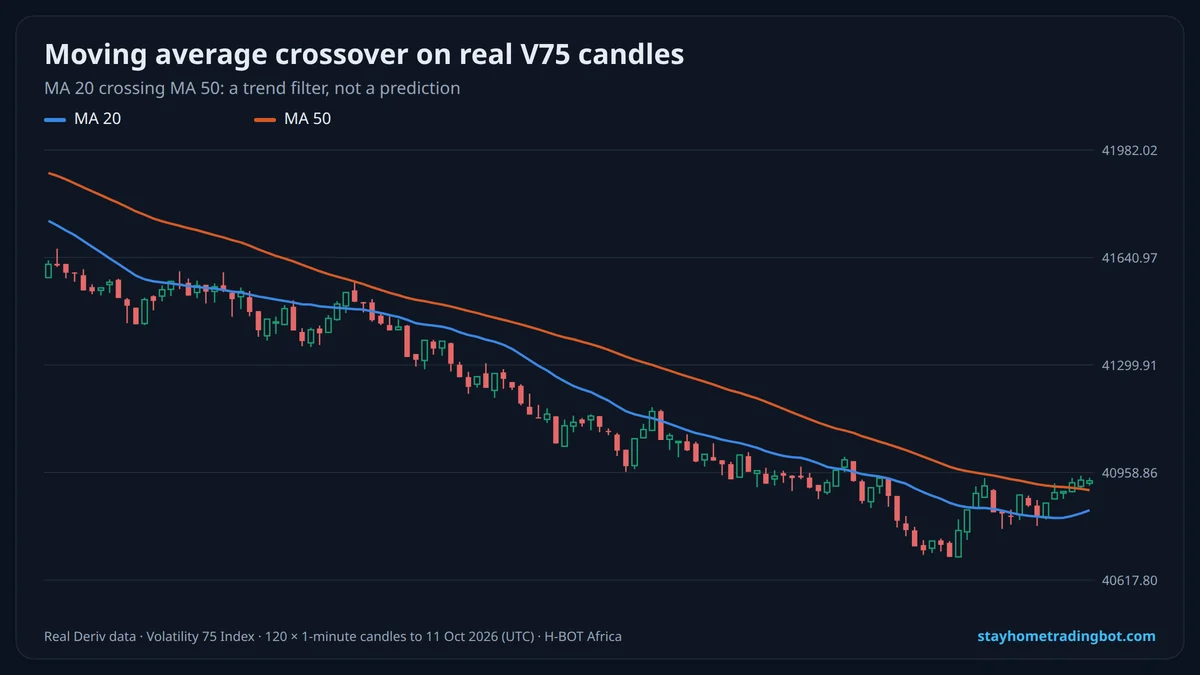 Moving Average Strategy for Deriv: Crossovers, Trend Filters and Settings
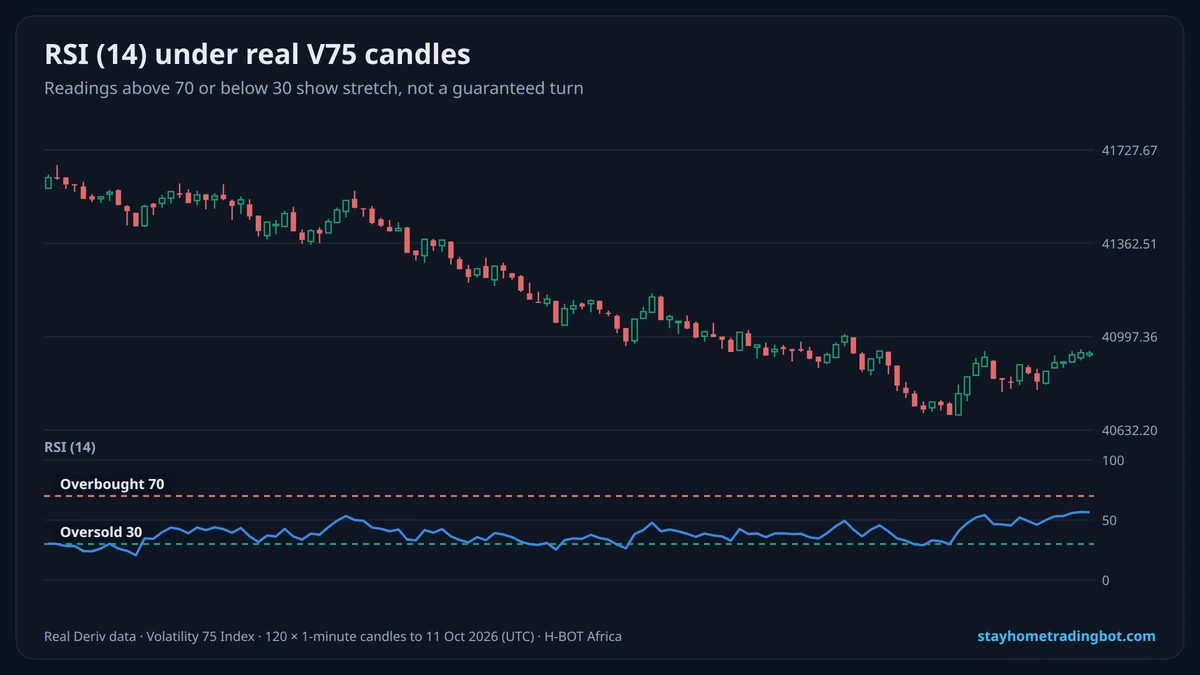 RSI Strategy for Deriv Synthetic Indices: Settings, Signals and What Real Data Shows
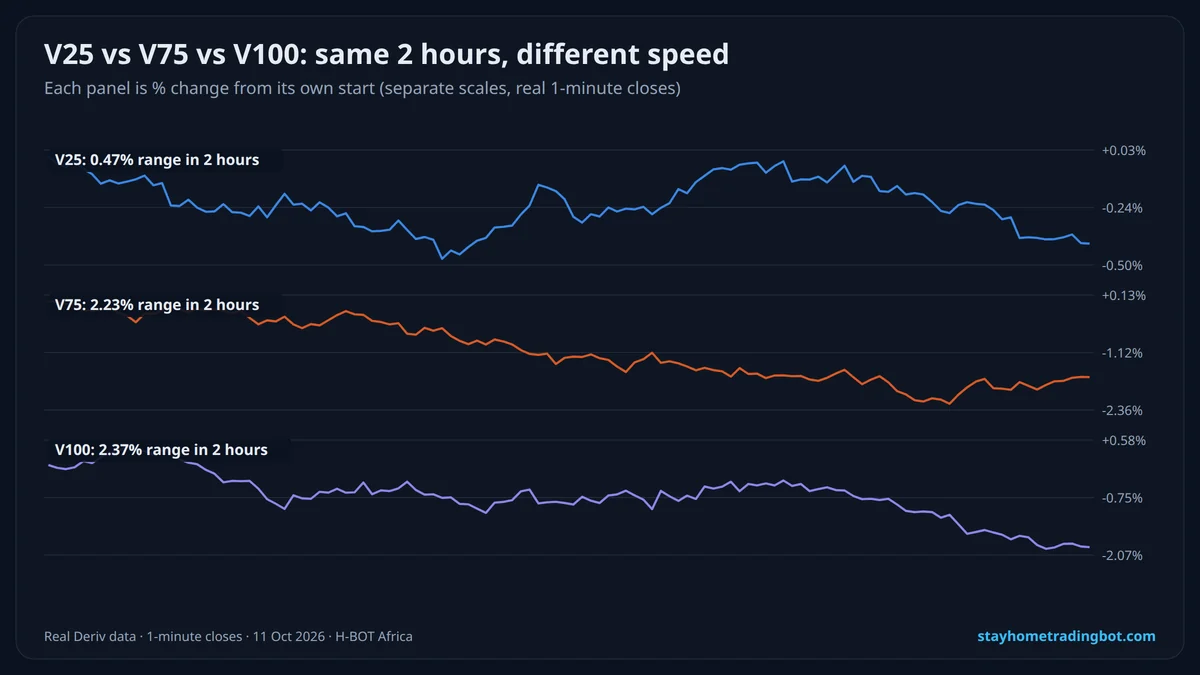 Best Indicators for Deriv Synthetic Indices: Which to Use and How to Combine Them
 Risk Management for Deriv Traders: Stake Size, Stop-Loss and Daily Limits That Protect Your Account