Fibonacci Retracement Strategy for Deriv: How to Draw It and Trade the Levels
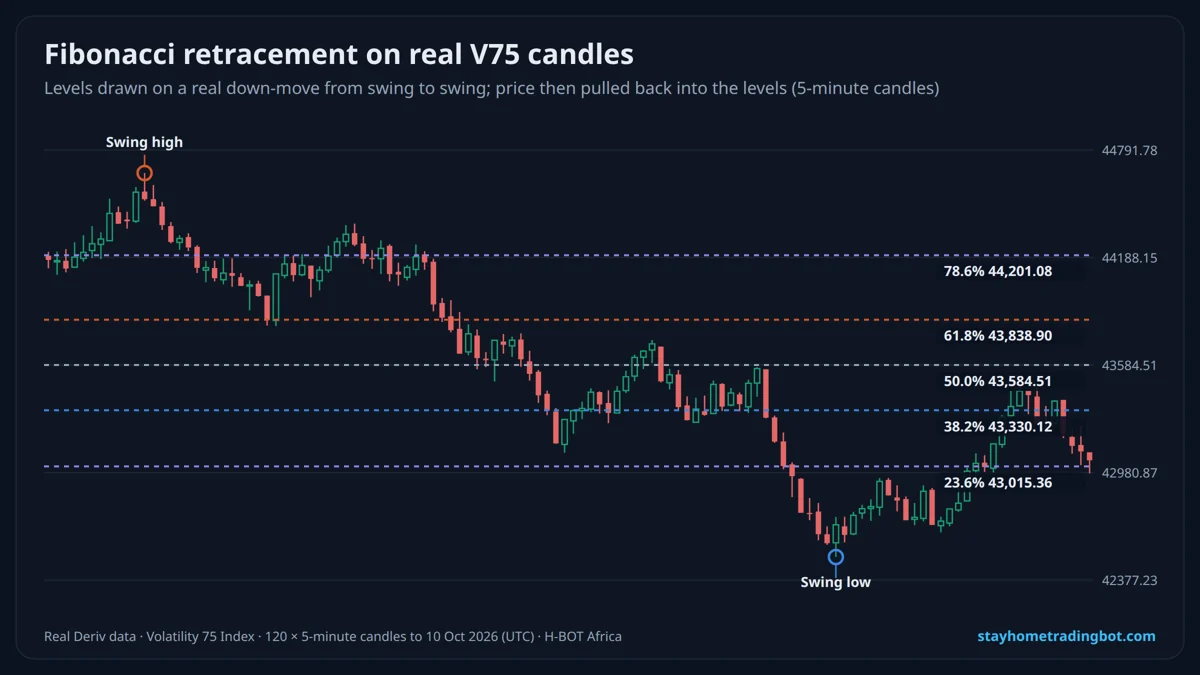
How to Draw Fibonacci Retracement
- Find a clear move with an obvious start and end (swing low and swing high).
- Select the Fibonacci tool on your chart.
- Up-trend: click the swing low, then drag to the swing high. Down-trend: high to low.
- The tool draws the levels automatically.
What the Levels Mean
| Level | What traders watch for |
|---|---|
| 23.6% | Shallow pullback in a strong trend |
| 38.2% | Common pullback zone |
| 50% | Not a Fibonacci ratio, but widely watched |
| 61.8% | "Golden ratio": deeper pullback, last good zone for many |
| 78.6% | Very deep; trend may be failing |
Best Fibonacci Settings
The default levels (23.6, 38.2, 50, 61.8, 78.6) are all you need. Draw on the timeframe you trade (5- or 15-minute charts on synthetics) and redraw when a new swing forms.
A Fibonacci Strategy to Test on Demo
| Rule | Example |
|---|---|
| Trend | Price above MA 50 = look for buys only |
| Zone | Wait for a pullback into 38.2–61.8% |
| Trigger | A bullish candle (hammer, engulfing) in the zone |
| Stop | Below the 78.6% level |
| Target | The previous swing high |
| Risk | 1–2% of balance per trade |
Combine with support and resistance and candlestick patterns: a Fibonacci level that lines up with an old support is stronger.
Does Fibonacci Work on Synthetic Indices?
Synthetic indices are random, so no level "attracts" price. Fibonacci helps you plan entries, stops and targets in a consistent way, which is valuable in itself. Judge it by a demo journal, not by hand-picked chart examples.
Try It Free on a $10,000 Demo
Open a free Deriv account, connect it to H-BOT Africa and test bots, signals and digit tools on virtual money before risking a shilling.
Open a free Deriv account Open Deriv Bot Open H-BOT Ask on WhatsApp
Have an audience? Become a Deriv partner and earn commission on clients you refer.
Disclosure: some links on this page are Deriv partner links. If you open an account or become a partner through them, H-BOT Africa may earn a commission at no extra cost to you.
Frequently Asked Questions
How do you draw Fibonacci retracement?
From swing low to swing high in an up-trend, or from high to low in a down-trend.
What is the best Fibonacci level?
The 38.2–61.8% zone is the most watched; 61.8% is called the golden ratio.
Does Fibonacci work on Volatility 75?
It helps structure trades but does not predict random synthetic prices; test on demo.
Which timeframe is best for Fibonacci?
The one you trade, often 5- to 15-minute charts on synthetics.
Is 50% a Fibonacci level?
Not mathematically, but it is included because traders watch it.
Can I use Fibonacci for intraday trading?
Yes; redraw it as new swings form.
Related Guides
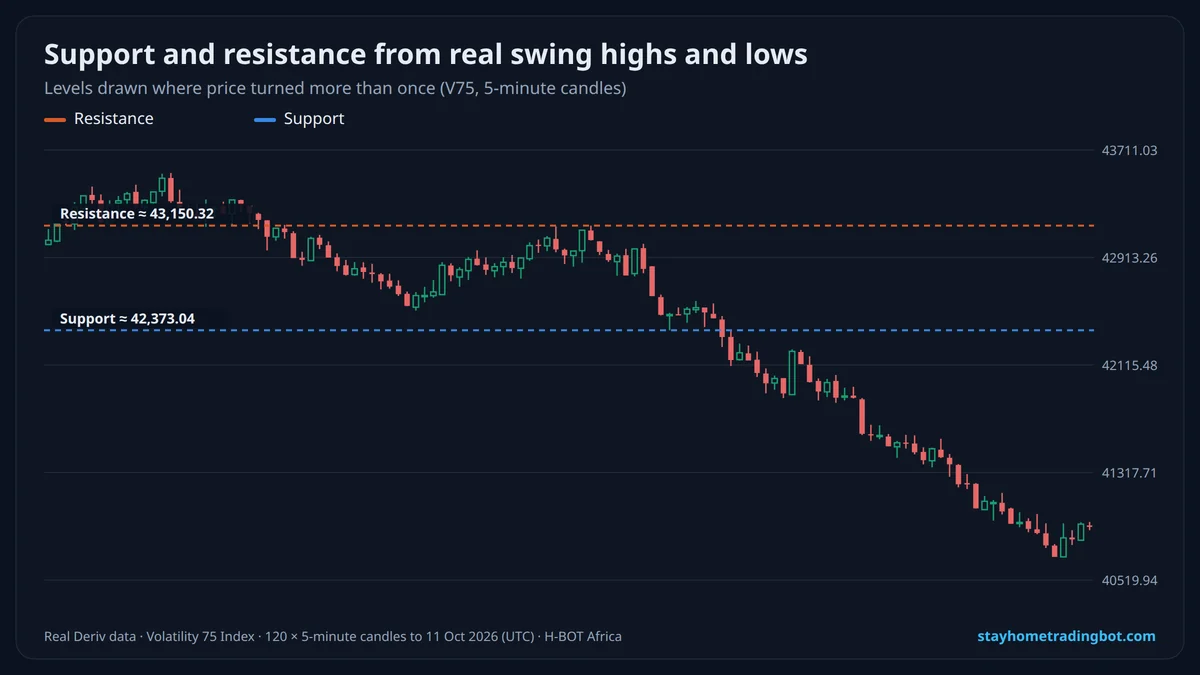 Support and Resistance on Deriv: How to Draw Levels and Trade Them Safely
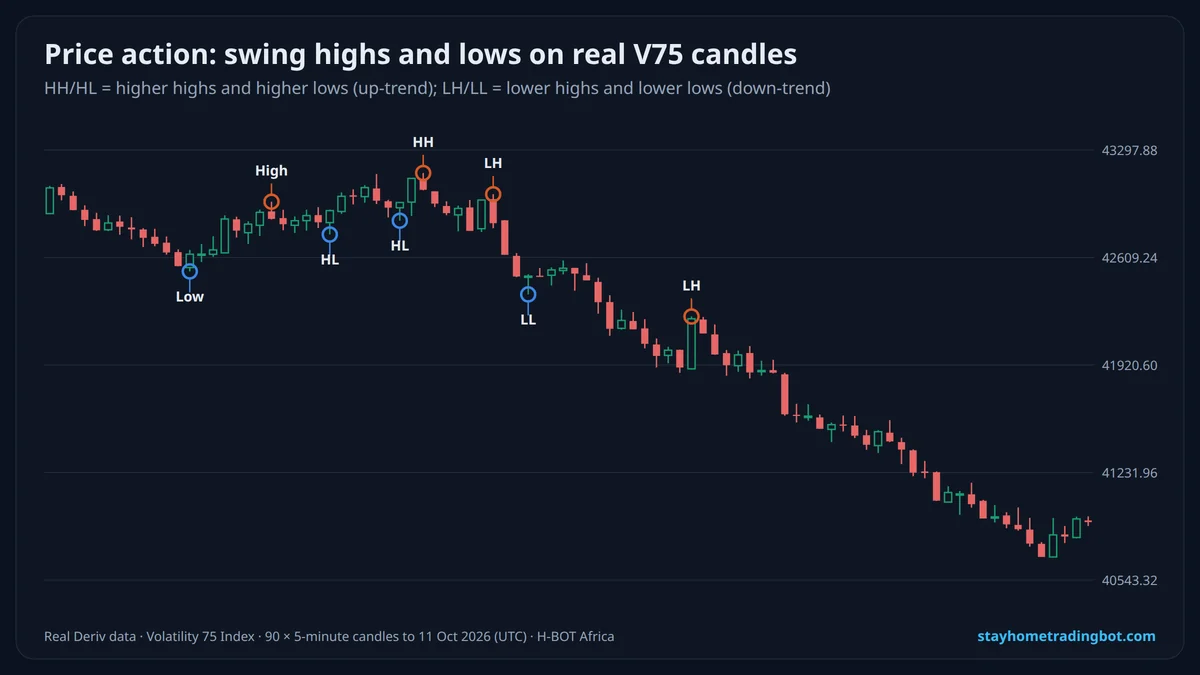 Price Action Trading for Deriv: Reading Swings, Trends and Candles Without Indicators
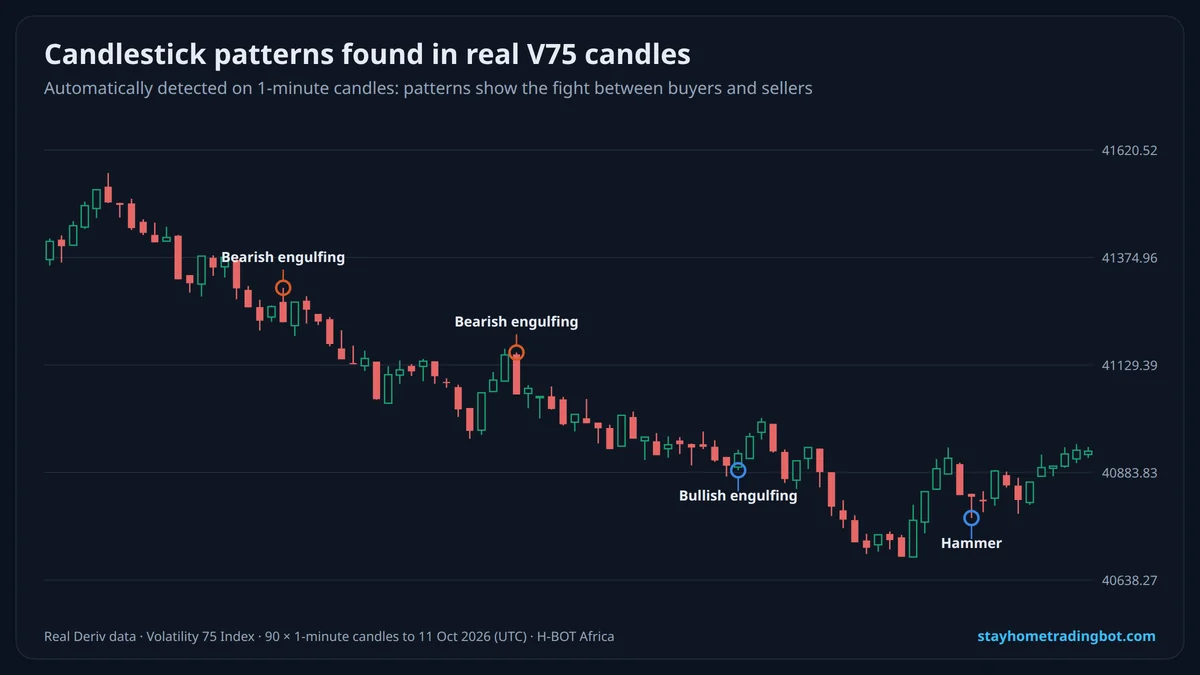 Candlestick Patterns for Deriv Traders: Doji, Hammer, Engulfing and How to Use Them
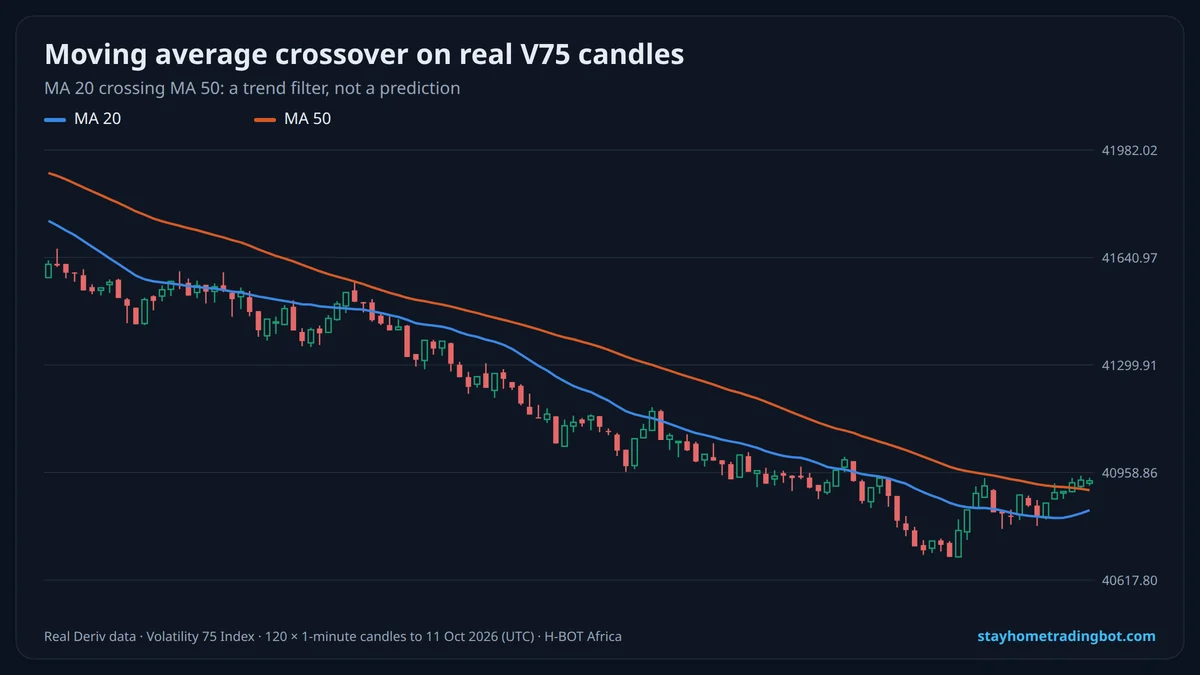 Moving Average Strategy for Deriv: Crossovers, Trend Filters and Settings