Breakout Strategy for Deriv: Trading Ranges, Trend Lines and Avoiding False Breakouts
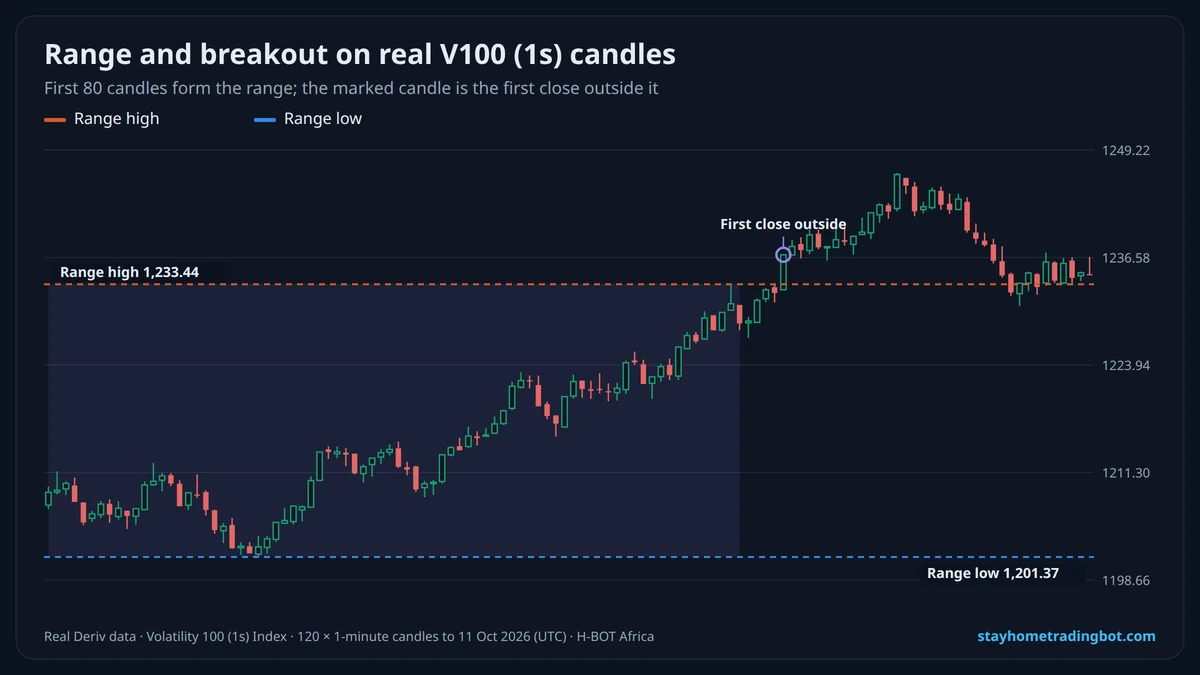
Types of Breakout
| Breakout | How to mark it |
|---|---|
| Range breakout | Horizontal high and low that held at least twice |
| Trend line breakout | Line through two or more swing lows (up-trend) or highs (down-trend) |
| Squeeze breakout | Bollinger Bands narrowing, then a close outside |
How to Trade a Breakout
- Mark the range or line on a 1- to 15-minute chart before the move happens.
- Wait for a full candle close beyond it; wicks through the level do not count.
- Enter on the close, or wait for a retest of the broken level.
- Stop: back inside the range (below the old high for an upside breakout).
- Target: the height of the range added to the breakout point, or a fixed 2:1 reward-to-risk.
False Breakouts
A false breakout pokes through the level, then falls back into the range, often trapping breakout buyers. Ways to filter them:
- Wait for the candle to close, not just touch.
- Prefer breakouts in the direction of the higher-timeframe trend.
- Skip breakouts after a very long move with no pause.
- Use the retest entry: if the level holds on the retest, the breakout is more convincing.
Trend Lines
Draw trend lines through swing lows in an up-trend and swing highs in a down-trend. The more touches, the more traders watch it. A close through a well-tested trend line is an early sign the trend is changing; see price action trading.
Related: Bollinger Band squeezes and support and resistance.
Try It Free on a $10,000 Demo
Open a free Deriv account, connect it to H-BOT Africa and test bots, signals and digit tools on virtual money before risking a shilling.
Open a free Deriv account Open Deriv Bot Open H-BOT Ask on WhatsApp
Have an audience? Become a Deriv partner and earn commission on clients you refer.
Disclosure: some links on this page are Deriv partner links. If you open an account or become a partner through them, H-BOT Africa may earn a commission at no extra cost to you.
Frequently Asked Questions
What is a breakout strategy?
Entering when price closes outside a range or trend line and expecting the move to continue.
How do you avoid false breakouts?
Wait for a candle close, trade with the bigger trend, and consider entering on the retest.
Where should the stop go on a breakout trade?
Back inside the range, beyond the broken level.
What is the best timeframe for breakouts on Deriv?
1- to 15-minute charts are common on synthetics; test the one you trade.
How do I draw a trend line?
Through at least two swing lows in an up-trend or two swing highs in a down-trend.
Do breakouts work on Volatility indices?
Some continue and many fail; the stop and position size decide the result.
Related Guides
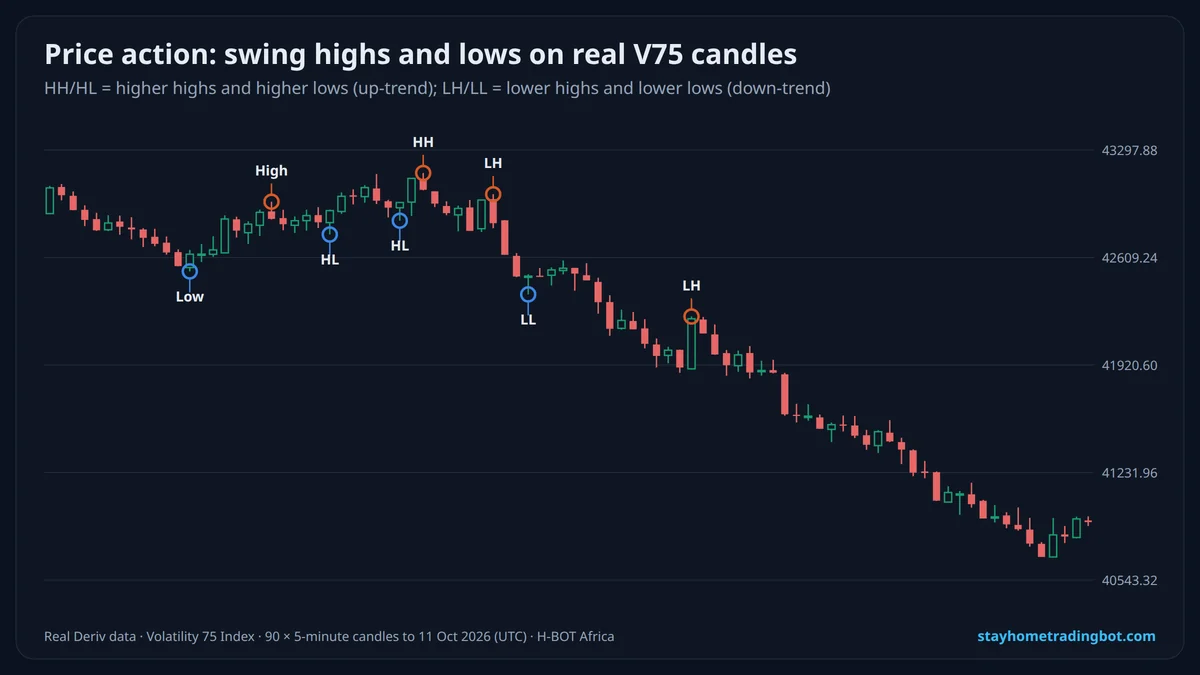 Price Action Trading for Deriv: Reading Swings, Trends and Candles Without Indicators
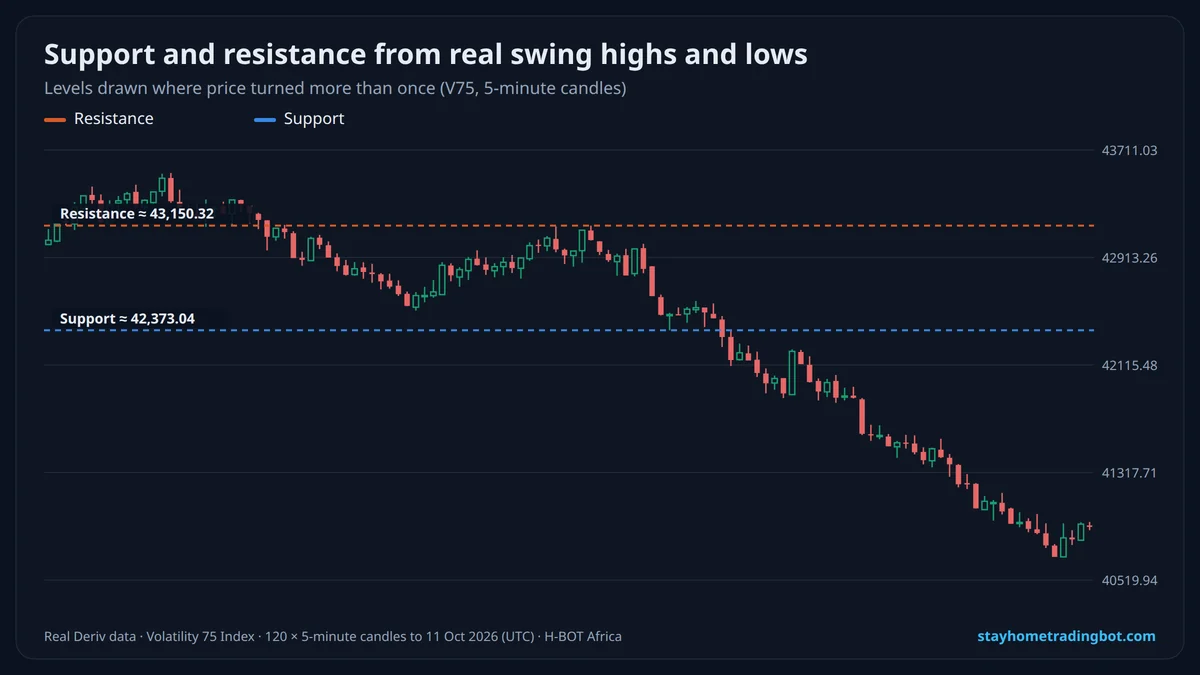 Support and Resistance on Deriv: How to Draw Levels and Trade Them Safely
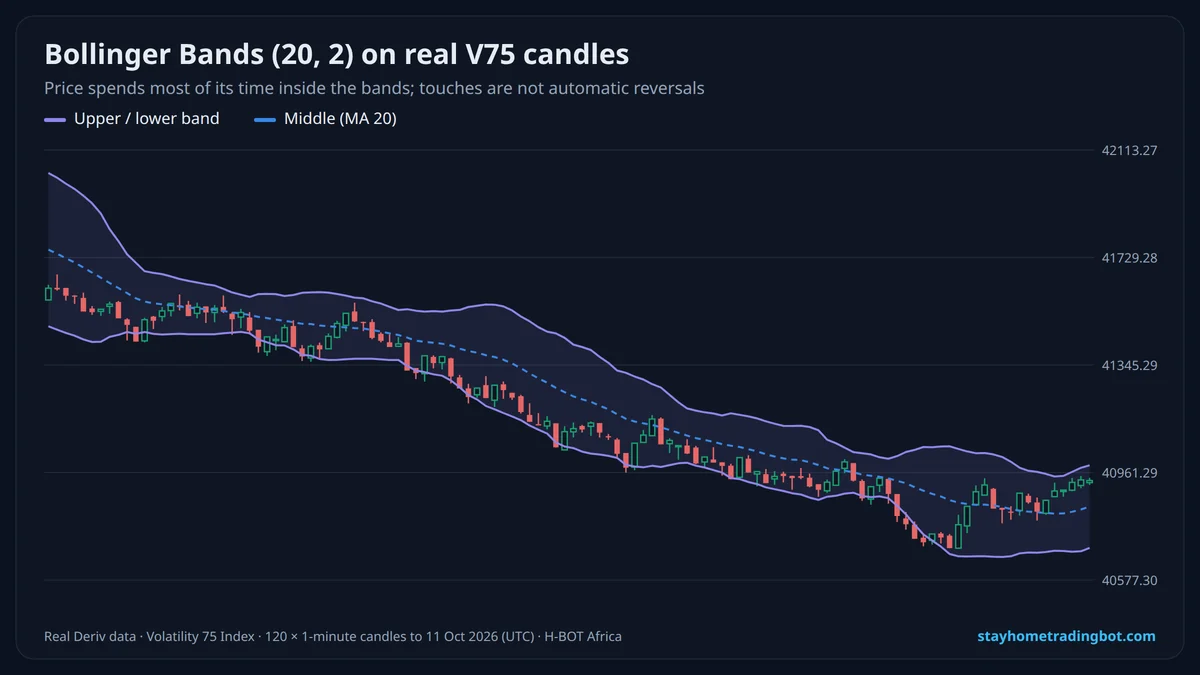 Bollinger Bands Strategy for Deriv: Squeeze, Band Walk and Mean Reversion
 Scalping Strategy for Deriv: A 1-Minute Plan, Best Indices and How Not to Overtrade