Parabolic SAR Strategy: How the Dots Work, Best Settings and What 48 Real Flips on V75 Showed
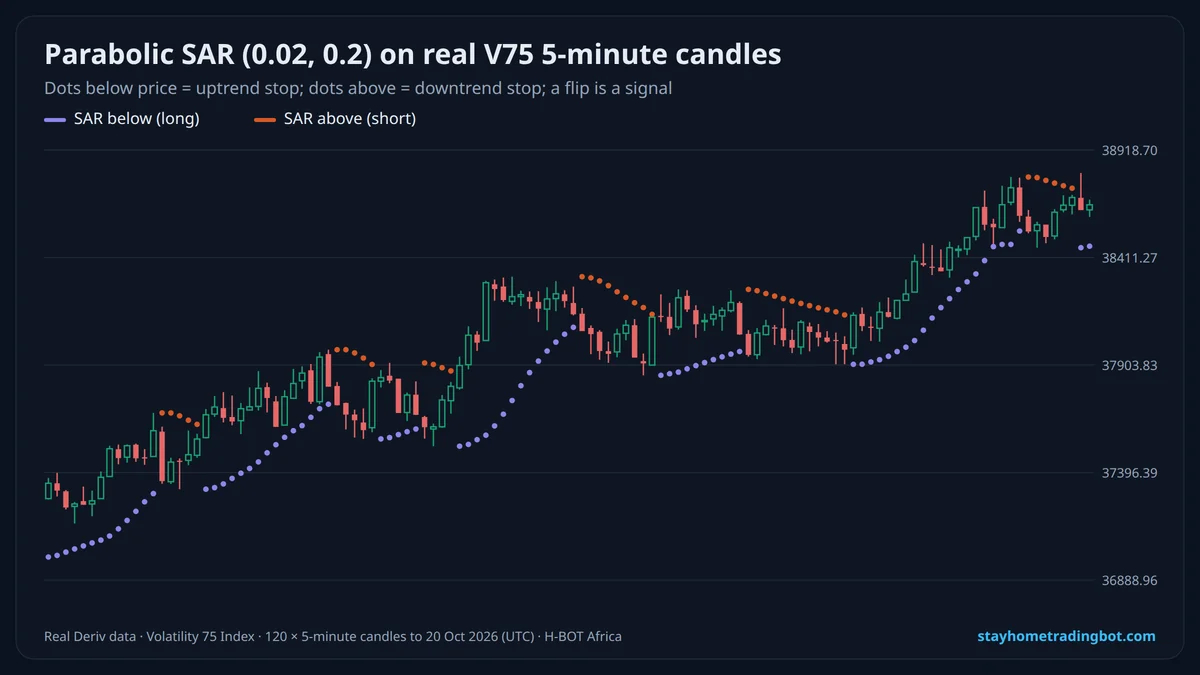
How the Parabolic SAR Works
- In an uptrend the SAR starts at the recent low and moves up toward price on every candle.
- The acceleration factor starts at 0.02 and rises by 0.02 each time price makes a new high, up to the 0.2 maximum, so the dots speed up as the trend runs.
- When price touches the dots, the trend is considered over and the SAR flips to the other side.
Settings
| Setting | Effect |
|---|---|
| 0.02 / 0.2 (standard) | Balanced |
| 0.01 / 0.1 | Slower, fewer flips, later exits |
| 0.04 / 0.4 | Faster, many flips, many false signals |
Real Test on Volatility 75
| Measure | Result |
|---|---|
| Candles tested | 500 (5-minute) |
| SAR flips | 48 |
| Flips followed by a move in that direction over 6 candles | 51.1% (24 of 47) |
Using the SAR as a Trailing Stop
Where the SAR helps is managing a trade you already took for another reason. With a multiplier position, move your stop loss to the SAR dot after each candle closes. You keep part of the move if the trend runs, and you exit when the dots flip. Compare it with the 2×ATR trailing stop.
Double Parabolic SAR
Some traders add a second, slower SAR (for example 0.01 / 0.1) and only act when both agree. This cuts the number of signals, but it cannot create an edge on a random index; test it on demo first.
Try It Free on a $10,000 Demo
Open a free Deriv account, connect it to H-BOT Africa and test bots, signals and digit tools on virtual money before risking a shilling.
Open a free Deriv account Open Deriv Bot Open H-BOT Ask on WhatsApp
Have an audience? Become a Deriv partner and earn commission on clients you refer.
Disclosure: some links on this page are Deriv partner links. If you open an account or become a partner through them, H-BOT Africa may earn a commission at no extra cost to you.
Frequently Asked Questions
What is the Parabolic SAR?
A trend indicator that places dots under or over price and flips when price crosses them.
What are the best Parabolic SAR settings?
The standard 0.02 step and 0.2 maximum suit most charts.
Is Parabolic SAR a good entry signal?
In our real V75 test flips were right 51% of the time, about the same as chance.
How do I use Parabolic SAR as a stop loss?
Move your stop to the latest SAR dot after each candle closes.
What is double Parabolic SAR?
Using two SARs with different settings and trading only when both agree.
Does Parabolic SAR repaint?
No. Once a candle closes, its dot stays where it was drawn.
Related Guides
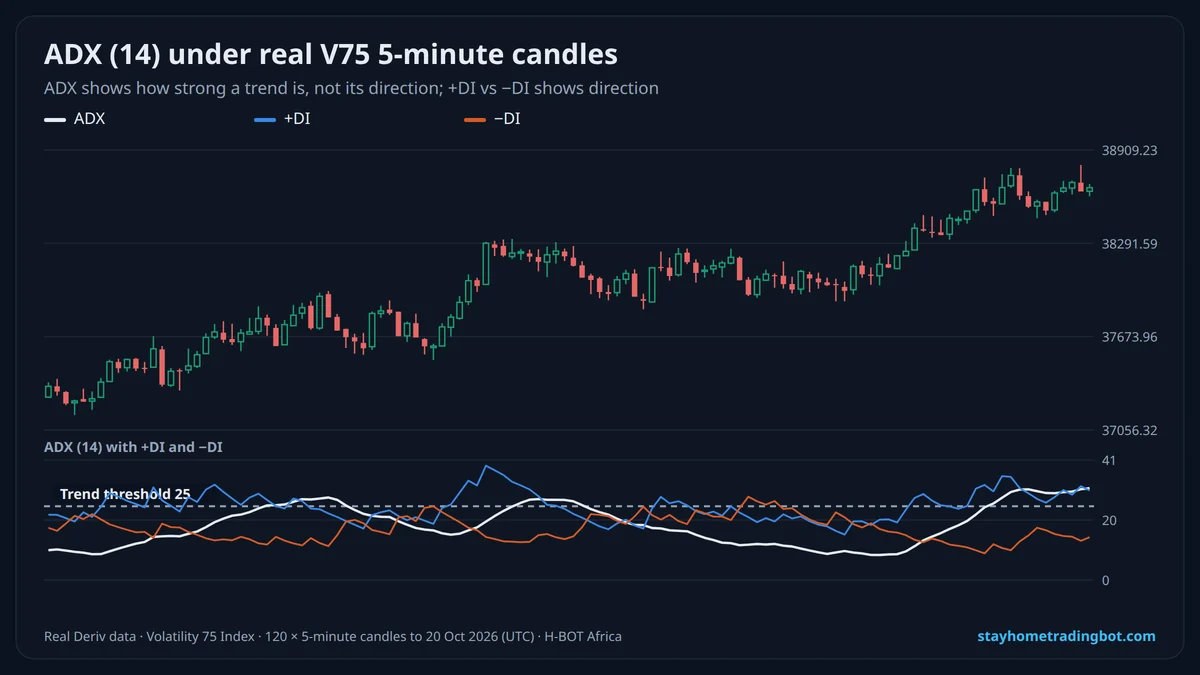 NEWADX Indicator Explained: Best Settings, +DI and −DI, and What a Test on Real V75 Candles Showed
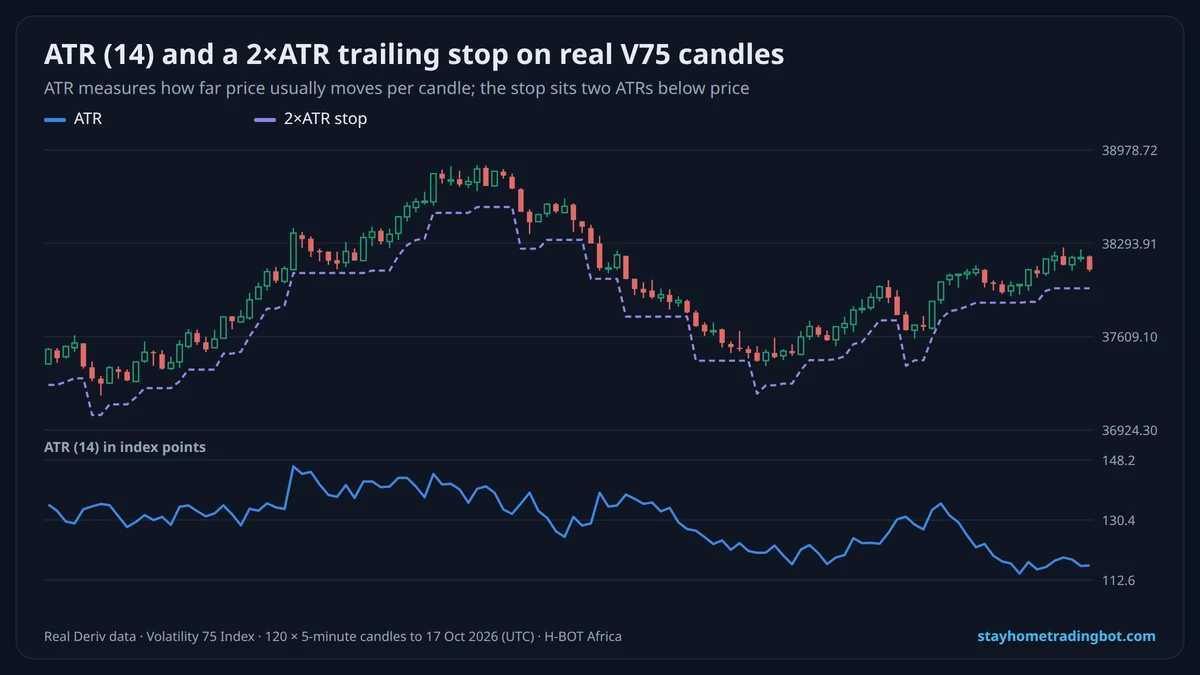 ATR Indicator for Deriv Traders: How to Read It and Set Stop Losses With It
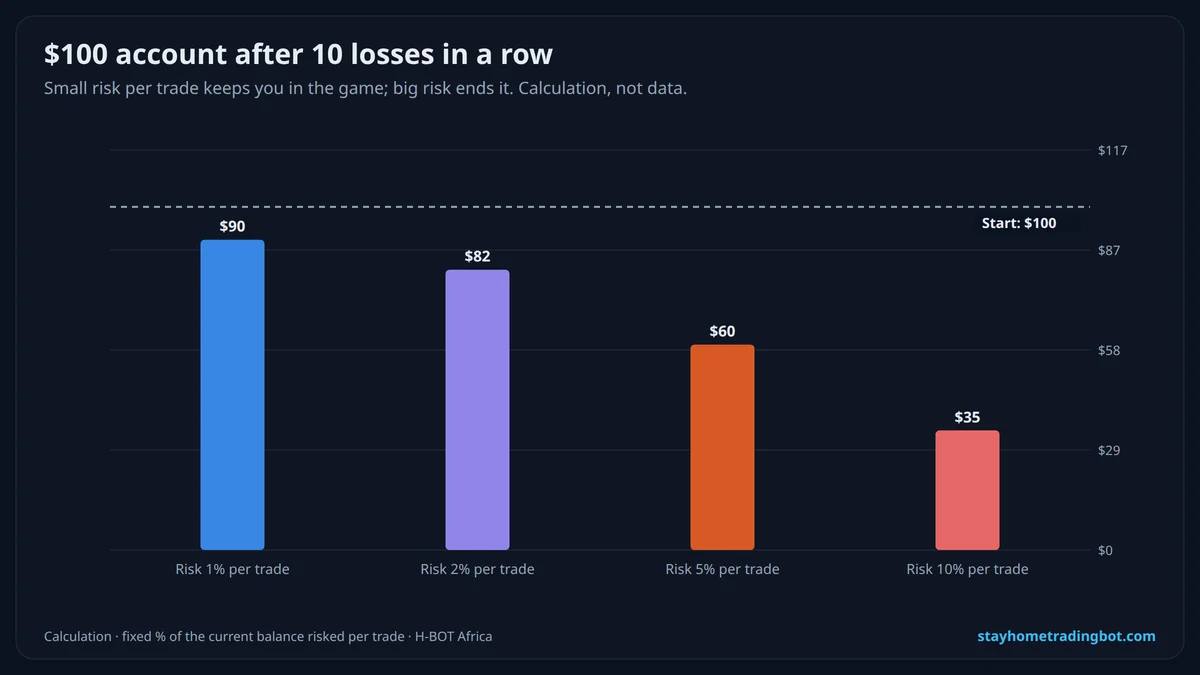 Stop Loss and Take Profit on Deriv: How to Set Them, Best Ratios and Bot Settings
 Moving Average Strategy for Deriv: Crossovers, Trend Filters and Settings