ADX Indicator Explained: Best Settings, +DI and −DI, and What a Test on Real V75 Candles Showed
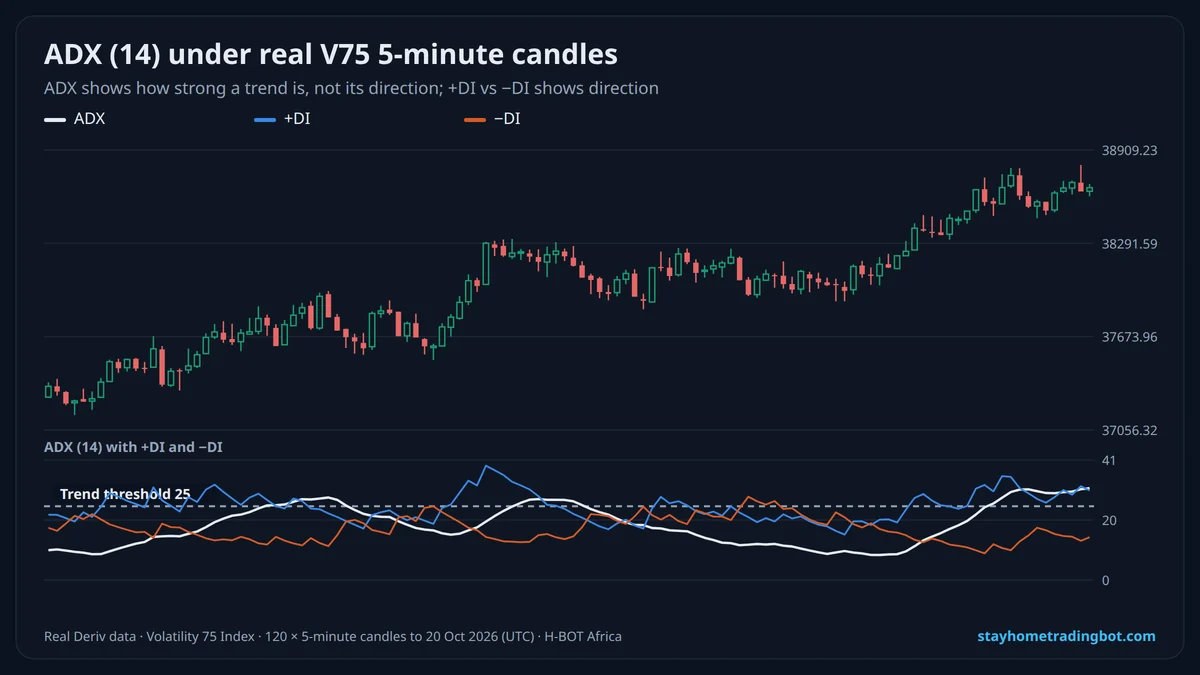
How the ADX Is Calculated (Simply)
- +DM: how much today’s high went above yesterday’s high. −DM: how much today’s low went below yesterday’s low.
- Both are smoothed over 14 periods and divided by the average true range (see {L("atr-indicator-deriv", "ATR")}) to give +DI and −DI.
- DX = the gap between +DI and −DI divided by their sum, × 100.
- ADX = DX smoothed over 14 periods.
Reading the ADX
| ADX value | Common meaning |
|---|---|
| Below 20 | Weak or no trend: range trading |
| 20–25 | A trend may be starting |
| Above 25 | Strong trend |
| Above 40 | Very strong, often late in the move |
What Our Real-Data Test Showed
| Condition (500 V75 5-minute candles) | Signals | Price moved the DI way over the next 6 candles |
|---|---|---|
| ADX above 25, follow +DI/−DI | 156 | 41.7% |
| ADX below 20, follow +DI/−DI | 204 | 63.2% |
The “strong trend” signals did worse than a coin flip in this sample, and the “weak trend” ones did better. Signals that sit next to each other overlap, so these samples are smaller than they look. The honest lesson: on a random index, ADX describes the past; it does not predict the next half hour.
How to Use ADX Sensibly
- Use it as a filter, for example to avoid range strategies when ADX is high, not as an entry signal on its own.
- Combine with a direction tool such as {L("moving-average-strategy-deriv", "moving averages")}.
- Test every rule on demo with at least 100 trades.
How to Add ADX on Deriv
In Deriv Trader open the chart, tap Indicators, search “ADX” and keep period 14. On Deriv MT5 it is under Insert → Indicators → Trend → Average Directional Movement Index.
Try It Free on a $10,000 Demo
Open a free Deriv account, connect it to H-BOT Africa and test bots, signals and digit tools on virtual money before risking a shilling.
Open a free Deriv account Open Deriv Bot Open H-BOT Ask on WhatsApp
Have an audience? Become a Deriv partner and earn commission on clients you refer.
Disclosure: some links on this page are Deriv partner links. If you open an account or become a partner through them, H-BOT Africa may earn a commission at no extra cost to you.
Frequently Asked Questions
What does the ADX indicator show?
How strong a trend is, from 0 to 100, without showing its direction.
What is the best ADX setting?
14 periods is the standard; shorter settings react faster but give more false readings.
What is a good ADX value?
Above 25 is usually read as a strong trend; below 20 as no trend.
What is the difference between ADX and DI?
ADX measures strength; +DI and −DI show whether buyers or sellers are stronger.
Does ADX work on Volatility 75?
It describes past moves, but in our test it did not predict the next 30 minutes.
What is the full form of ADX?
Average Directional Index.
Related Guides
 ATR Indicator for Deriv Traders: How to Read It and Set Stop Losses With It
 Moving Average Strategy for Deriv: Crossovers, Trend Filters and Settings
 NEWParabolic SAR Strategy: How the Dots Work, Best Settings and What 48 Real Flips on V75 Showed
 Best Indicators for Deriv Synthetic Indices: Which to Use and How to Combine Them