ATR Indicator for Deriv Traders: How to Read It and Set Stop Losses With It
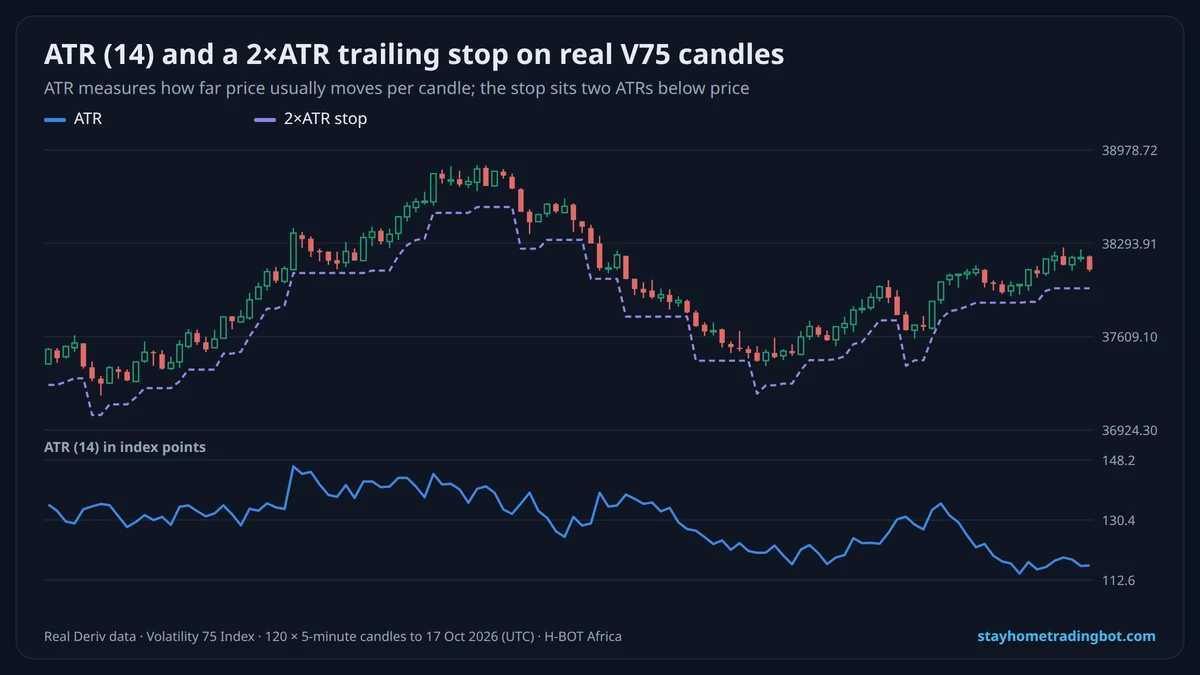
How ATR Is Calculated
- True range of a candle = the largest of: high − low, |high − previous close|, |low − previous close|.
- ATR = the average true range of the last 14 candles (smoothed).
- The result is in price points: an ATR of 130 on V75 means a typical 5-minute candle covers about 130 points.
Using ATR for Stop Losses
| Stop distance | Effect |
|---|---|
| 1× ATR | Tight: often hit by normal noise |
| 1.5× ATR | Common compromise |
| 2× ATR | Room for noise; smaller position needed |
| 3× ATR | Very wide; for longer trends |
A trailing ATR stop moves up as price rises (2× ATR under the close) and never moves down, so it locks in gains in a trend.
Using ATR for Position Size
Risk per trade ÷ stop distance = position size. Example: $500 account, 1% risk = $5; stop = 2× ATR. If each point is worth $0.02 at your lot size and 2× ATR is 260 points, the loss at the stop is $5.20, so the size is about right. See the lot size guide.
Using ATR on Deriv Options
- Turbos: pick a barrier further than the normal move for your duration (see {L("deriv-turbos", "Turbos")}).
- Touch/No Touch and Higher/Lower: compare the barrier with ATR to see how likely it is to be reached.
- Multipliers: set the stop loss in money that matches 1.5–2× ATR.
Try It Free on a $10,000 Demo
Open a free Deriv account, connect it to H-BOT Africa and test bots, signals and digit tools on virtual money before risking a shilling.
Open a free Deriv account Open Deriv Bot Open H-BOT Ask on WhatsApp
Have an audience? Become a Deriv partner and earn commission on clients you refer.
Disclosure: some links on this page are Deriv partner links. If you open an account or become a partner through them, H-BOT Africa may earn a commission at no extra cost to you.
Frequently Asked Questions
What is the ATR indicator?
A measure of how far price usually moves per candle, without showing direction.
What is the best ATR setting?
14 periods is standard; shorter reacts faster but is noisier.
How do I set a stop loss with ATR?
Place it 1.5–2× ATR beyond your entry or the last swing, then size the trade so that distance equals 1–2% of your balance.
Does a high ATR mean price will go up?
No. ATR measures movement size, not direction.
Can I use ATR on synthetic indices?
Yes; it shows the normal move size for each index and timeframe.
What is an ATR trailing stop?
A stop that follows price at a set ATR distance and only moves in your favour.
Related Guides
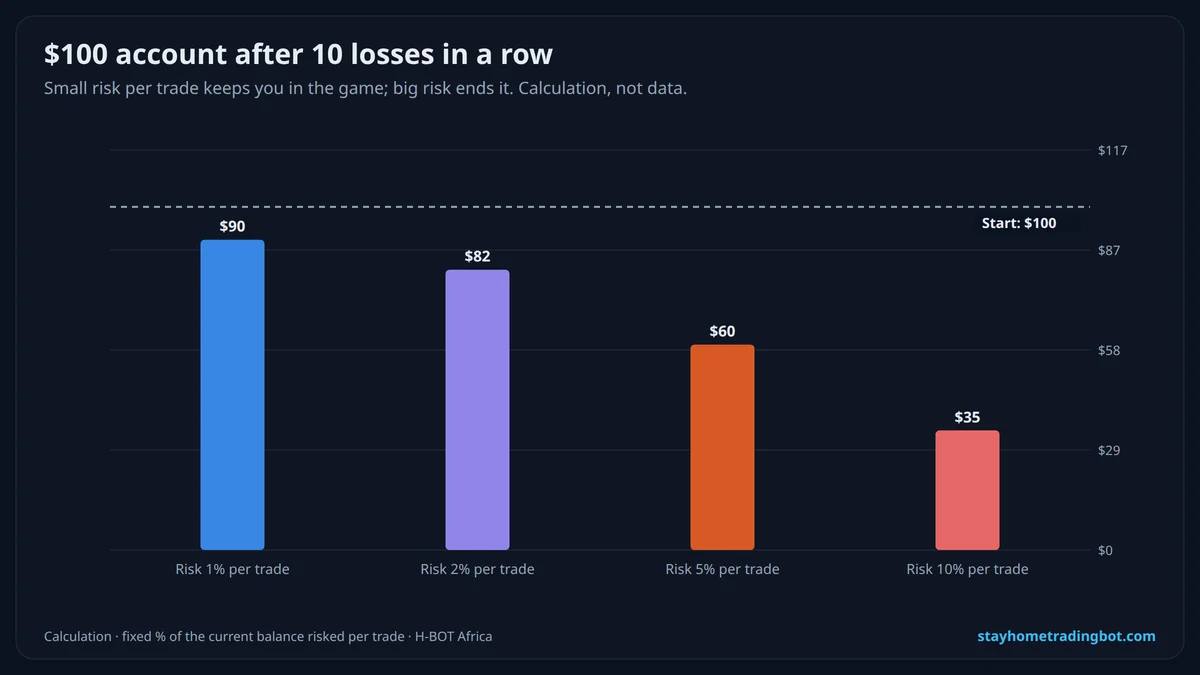 Stop Loss and Take Profit on Deriv: How to Set Them, Best Ratios and Bot Settings
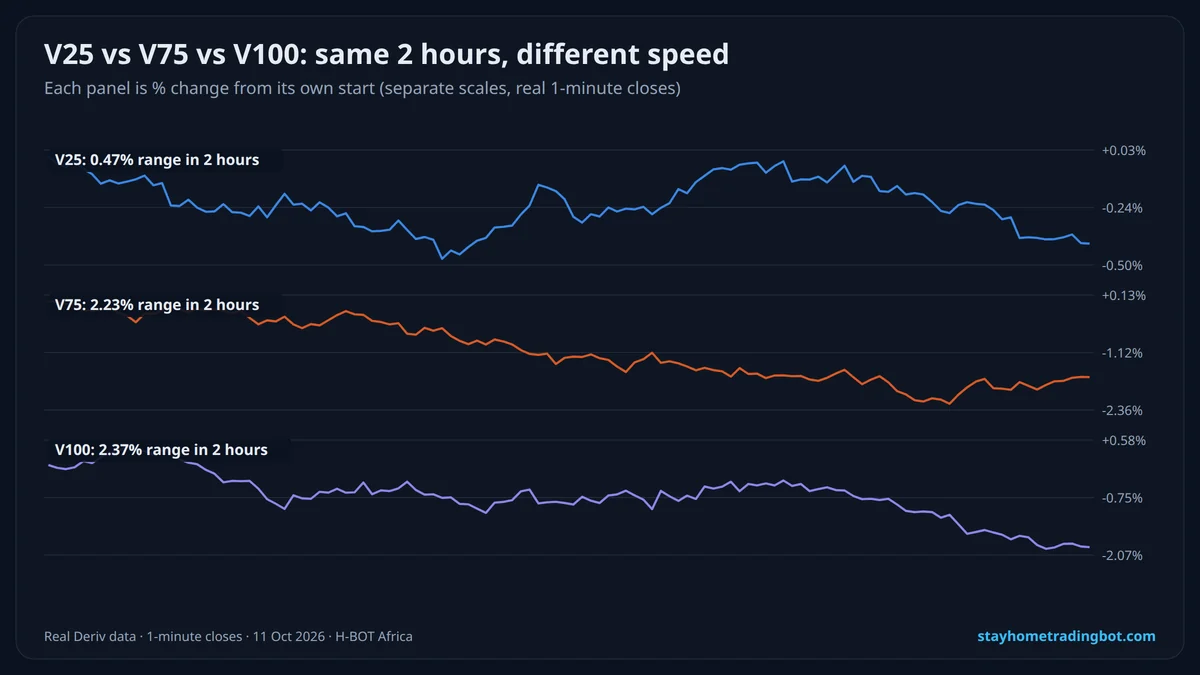 Deriv Lot Size Guide: How to Calculate Position Size for Synthetic Indices and Forex
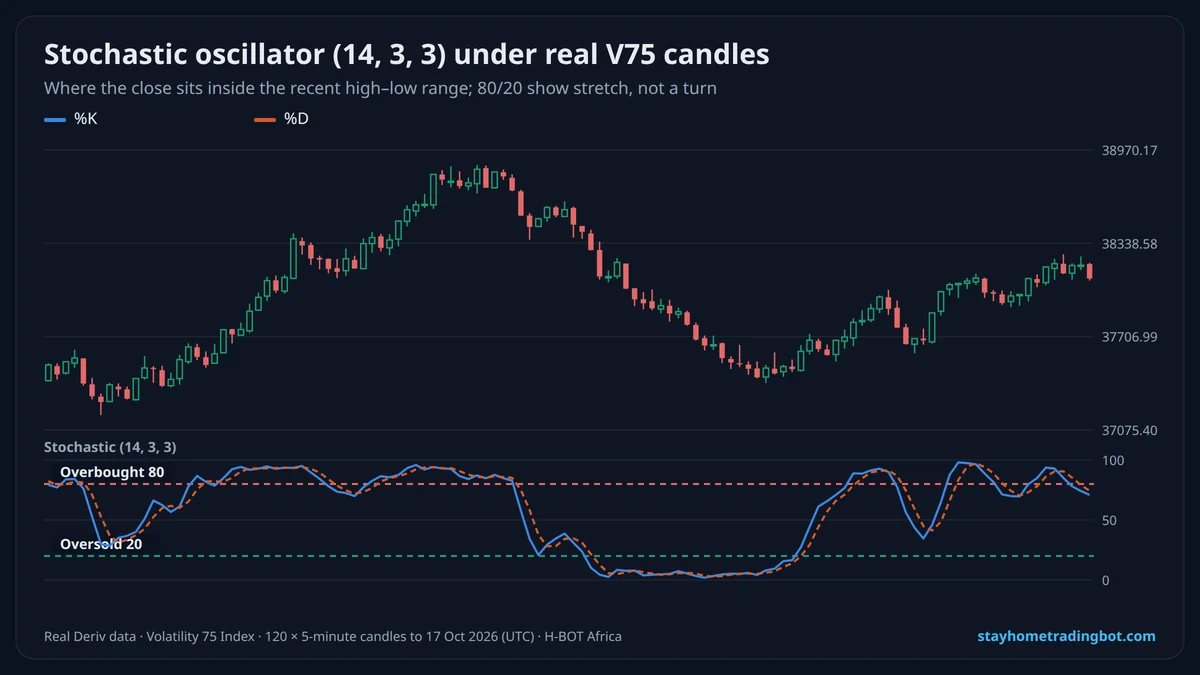 NEWStochastic Oscillator Strategy for Deriv: Settings, %K and %D and How to Use It Safely
 Risk Management for Deriv Traders: Stake Size, Stop-Loss and Daily Limits That Protect Your Account