Stochastic Oscillator Strategy for Deriv: Settings, %K and %D and How to Use It Safely
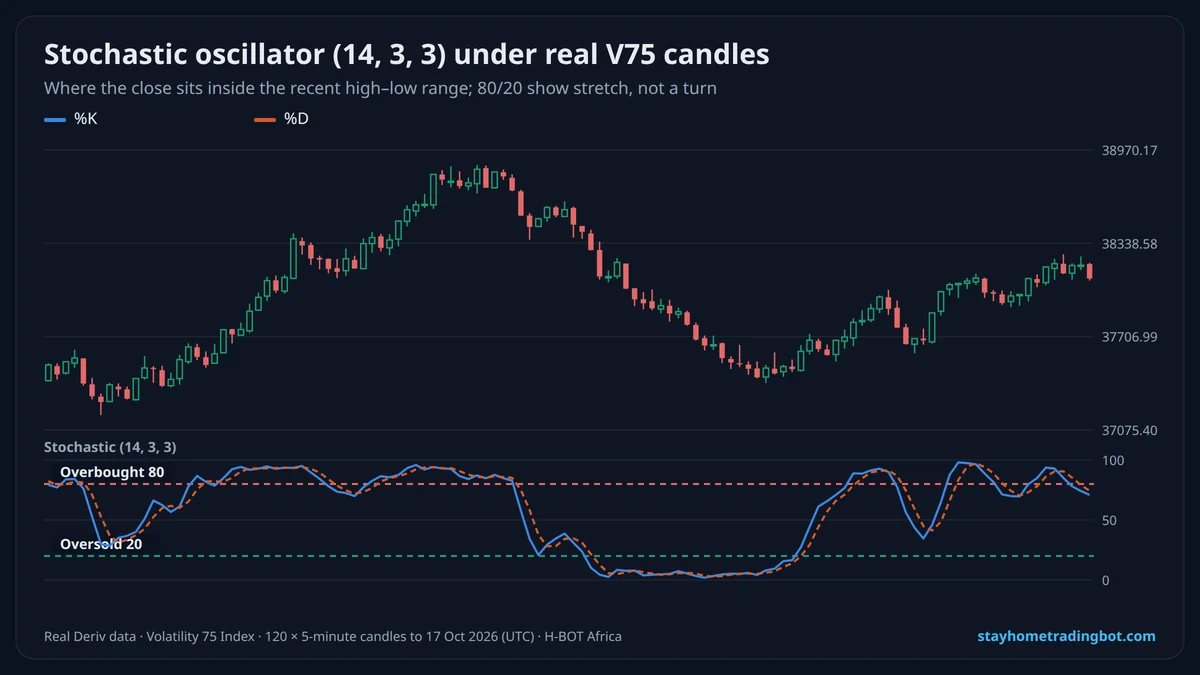
How the Stochastic Is Calculated
- Find the highest high and lowest low of the last 14 candles.
- %K = (close − lowest low) ÷ (highest high − lowest low) × 100.
- Smooth %K with a 3-period average (slow %K).
- %D = 3-period average of %K, the signal line.
Best Settings for Deriv
| Setting | Behaviour | Use |
|---|---|---|
| 5, 3, 3 | Fast, many signals | Scalping, more false signals |
| 14, 3, 3 | Balanced (default) | Most traders start here |
| 21, 5, 5 | Slow, fewer signals | Higher timeframes |
Three Ways Traders Use It
- Pullback in a trend: in an uptrend (price above the 50 MA), wait for the stochastic to dip below 20 and turn up.
- %K/%D cross: %K crossing above %D near the bottom of the range as confirmation.
- Divergence: price makes a new high but the stochastic does not, a sign the move is tiring (not a guaranteed turn).
A Simple Plan to Test on Demo
- Trend filter: only buy when price is above the 50-period moving average.
- Entry: stochastic drops below 20, then %K crosses above %D.
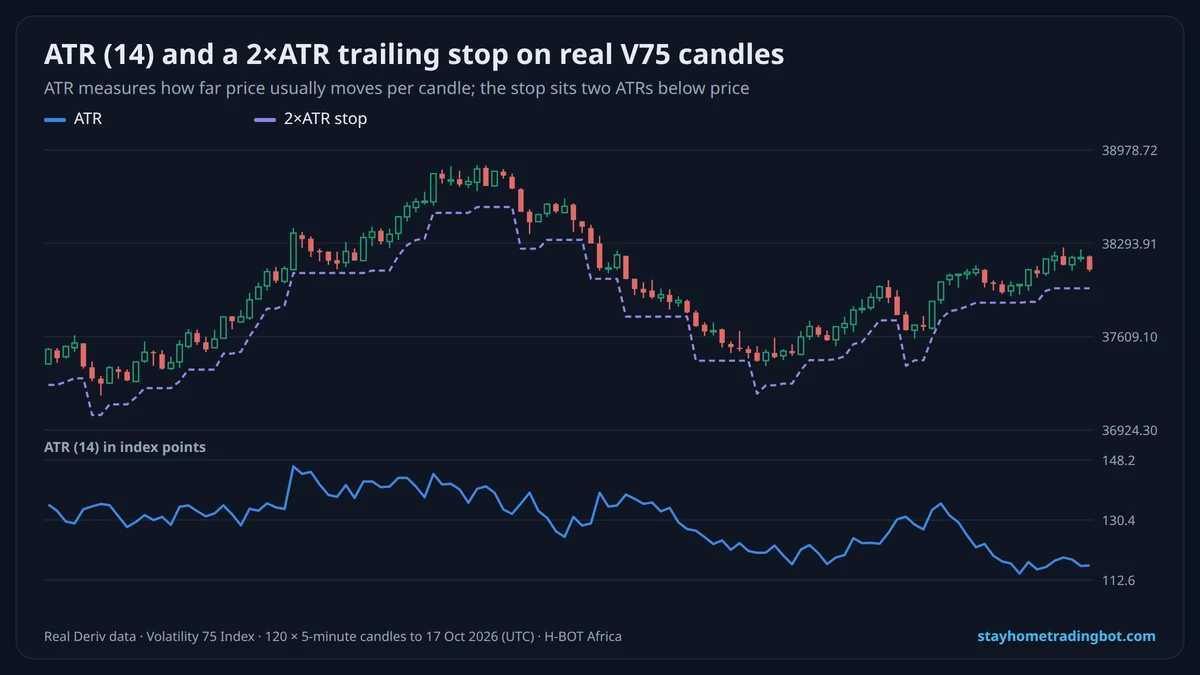
- Stop: below the recent swing low or 1.5× {L("atr-indicator-deriv", "ATR")}.
- Target: 1.5–2× the stop distance.
- Log 50 demo trades before judging it.
Try It Free on a $10,000 Demo
Open a free Deriv account, connect it to H-BOT Africa and test bots, signals and digit tools on virtual money before risking a shilling.
Open a free Deriv account Open Deriv Bot Open H-BOT Ask on WhatsApp
Have an audience? Become a Deriv partner and earn commission on clients you refer.
Disclosure: some links on this page are Deriv partner links. If you open an account or become a partner through them, H-BOT Africa may earn a commission at no extra cost to you.
Frequently Asked Questions
What is the best stochastic setting?
14, 3, 3 is the standard starting point; faster settings give more false signals.
What do 80 and 20 mean on the stochastic?
Price is near the top or bottom of its recent range, not that it must turn.
Is the stochastic good for Deriv synthetic indices?
It describes the range well, but it cannot predict random prices; use it with a trend filter.
What is the difference between %K and %D?
%K is the main line; %D is its 3-period average used as a signal line.
Stochastic or RSI?
Both measure momentum; RSI uses gains vs losses, stochastic uses the range. Pick one, not both.
Can I use the stochastic in a Deriv bot?
Deriv Bot has indicator blocks, but test rules on demo first.
Related Guides
 RSI Strategy for Deriv Synthetic Indices: Settings, Signals and What Real Data Shows
 MACD Strategy for Deriv: Signal Line Crosses, Histogram and Divergence
 Best Indicators for Deriv Synthetic Indices: Which to Use and How to Combine Them
 NEWATR Indicator for Deriv Traders: How to Read It and Set Stop Losses With It