Range Break Index on Deriv: How Range Break 100 and 200 Move and How to Trade Them With Multipliers
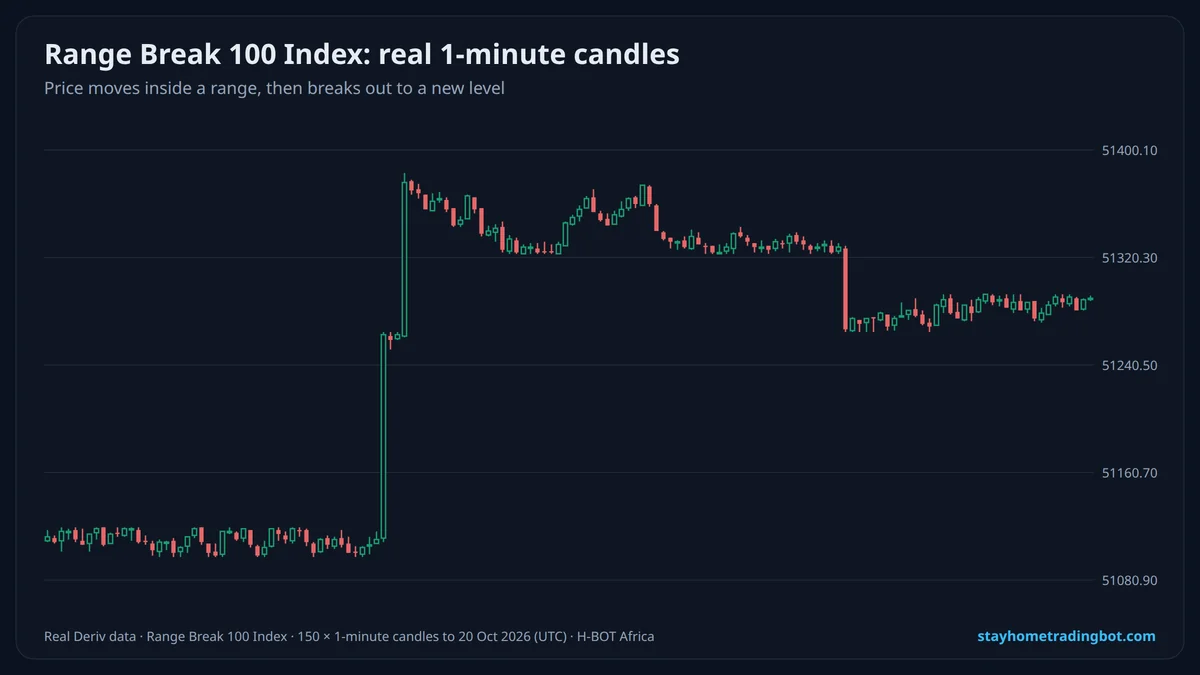
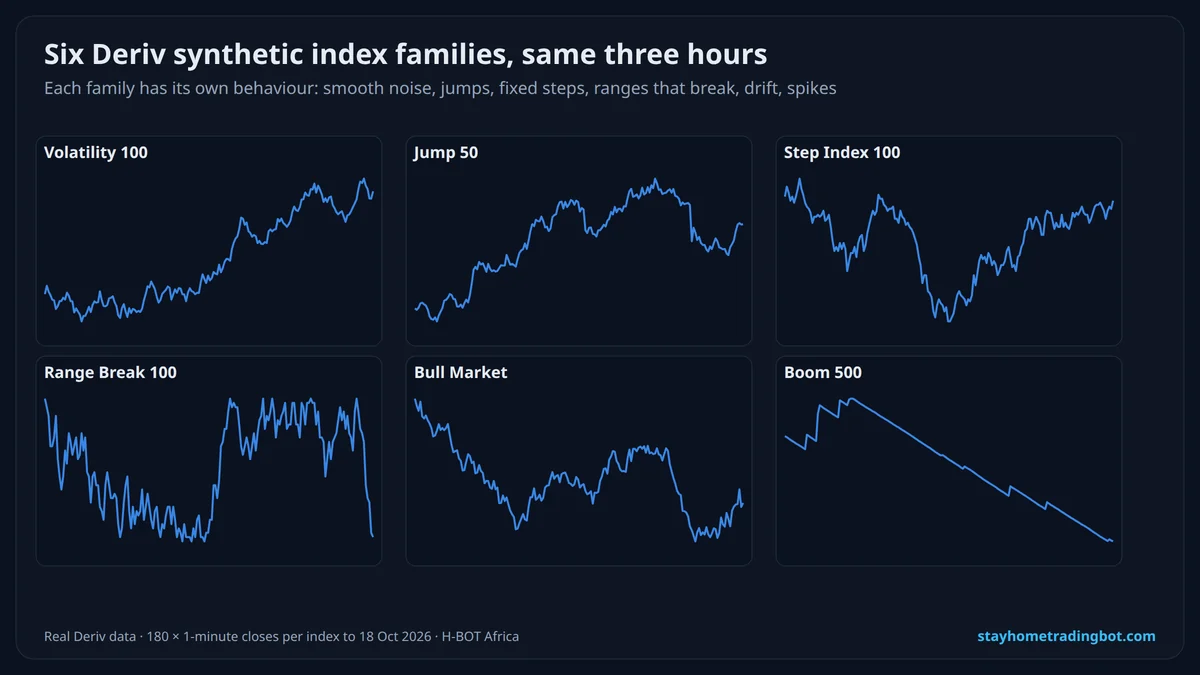
How Range Break Indices Move
- Most of the time price moves in small steps inside a band.
- Now and then it jumps out of the band and starts a new range at a different level.
- Breakouts can go up or down; the direction is random.
- They run 24/7, like other Deriv synthetic indices.
| Real 1-minute candles (600 each) | Range Break 100 | Range Break 200 |
|---|---|---|
| Median candle range | 10 points | 10 points |
| Largest candle | 216 points | 286 points |
| Candles bigger than 3× the median | 1.8% | 0.3% |
| Average range as % of price | 0.025% | 0.016% |
Trading Range Break With Multipliers
- Mark the current range: the recent high and low where price keeps turning.
- Inside the range, do nothing or trade small. A breakout can come at any time.
- If you trade a breakout, enter only after price closes outside the range, with a stop loss back inside the range.
- Use a take profit; a new range often forms soon after the break.
- Keep a full stop-out at 1–2% of your balance.
Learn the method behind this in our breakout strategy guide and support and resistance.
Try It Free on a $10,000 Demo
Open a free Deriv account, connect it to H-BOT Africa and test bots, signals and digit tools on virtual money before risking a shilling.
Open a free Deriv account Open Deriv Bot Open H-BOT Ask on WhatsApp
Have an audience? Become a Deriv partner and earn commission on clients you refer.
Disclosure: some links on this page are Deriv partner links. If you open an account or become a partner through them, H-BOT Africa may earn a commission at no extra cost to you.
Frequently Asked Questions
What is the Range Break Index?
A Deriv synthetic index that moves inside a range and then breaks out to a new level.
What is the difference between Range Break 100 and 200?
Range Break 200 breaks out less often, so it is calmer; in our data big candles were rarer on RB200.
Which contracts can I trade on Range Break?
On 20 October 2026 Deriv offered multipliers only.
Can I predict a Range Break breakout?
Not reliably. Breakout timing and direction are random.
Is Range Break good for beginners?
Only with small stakes; breakouts can skip past stop losses.
Does Range Break trade on weekends?
Yes, it runs 24/7.
Related Guides
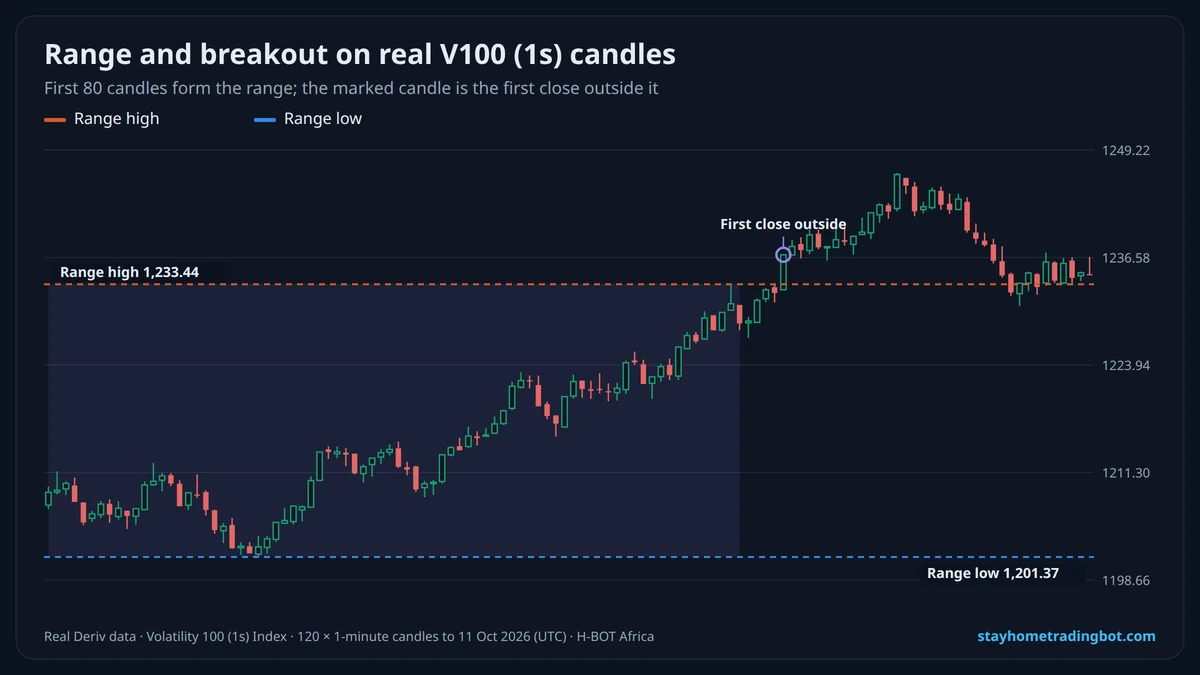 Breakout Strategy for Deriv: Trading Ranges, Trend Lines and Avoiding False Breakouts
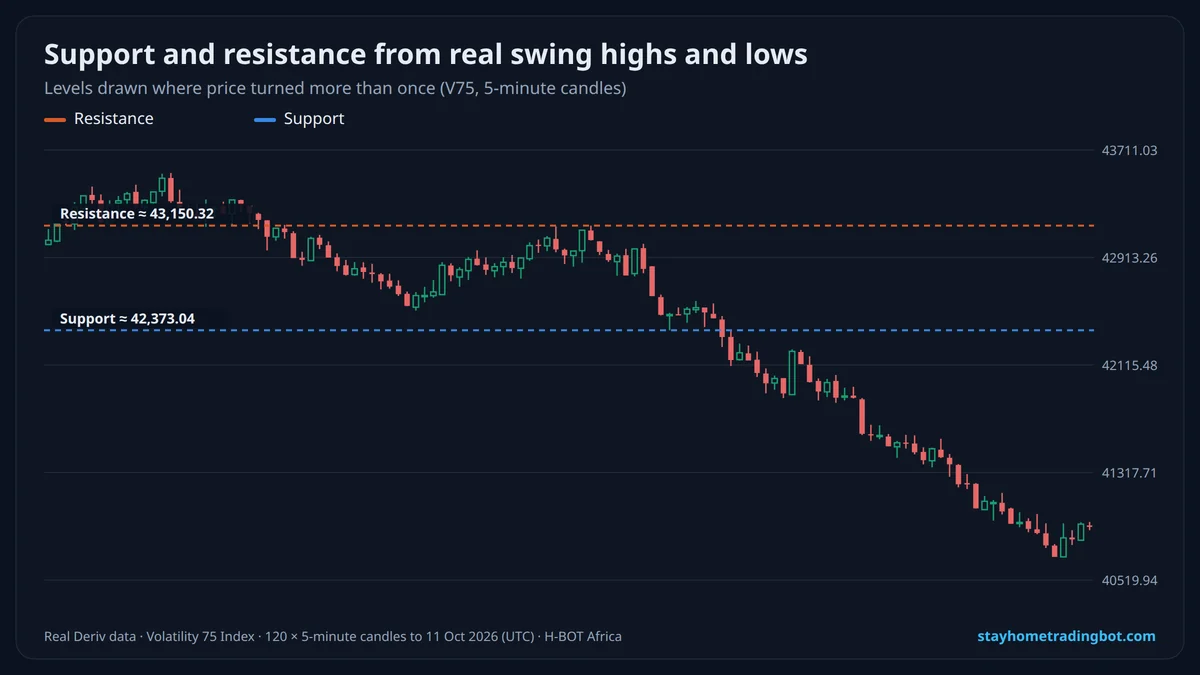 Support and Resistance on Deriv: How to Draw Levels and Trade Them Safely
 Deriv Multipliers Explained: How They Work, Stop-Out, Deal Cancellation and Safer Use
 Deriv Synthetic Indices Explained: Volatility, Boom and Crash, Jump, Step, Range Break and More