Deriv Synthetic Indices Explained: Volatility, Boom and Crash, Jump, Step, Range Break and More
The Families at a Glance
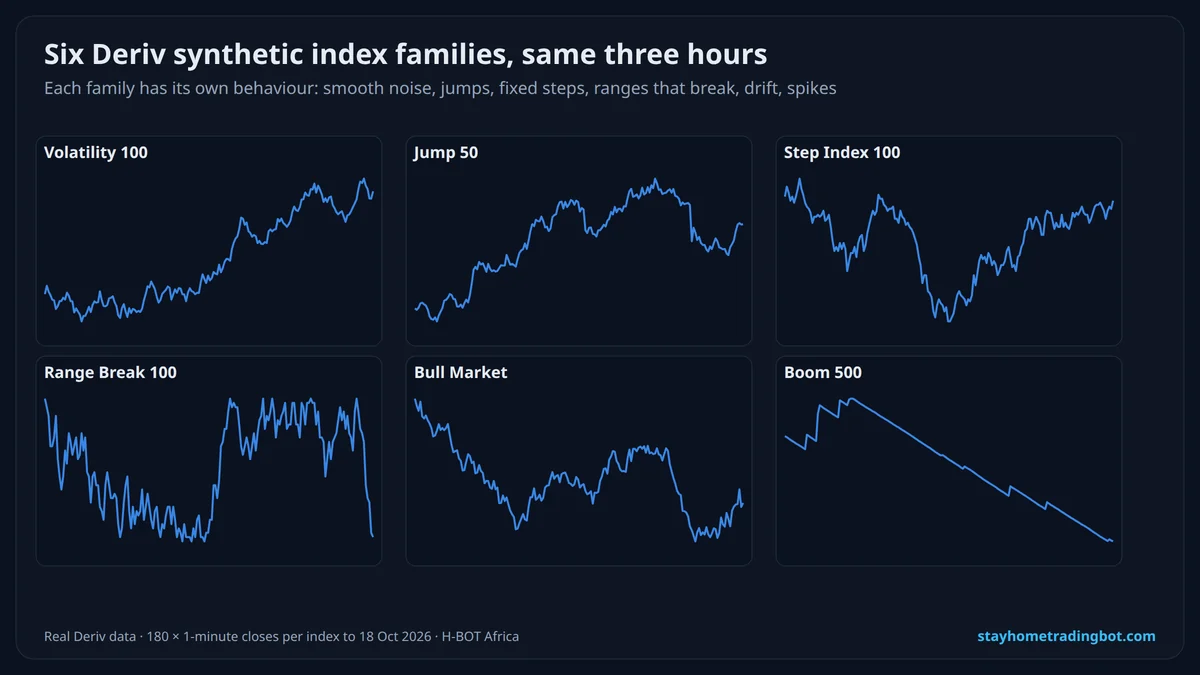
| Family | Examples | How it moves |
|---|---|---|
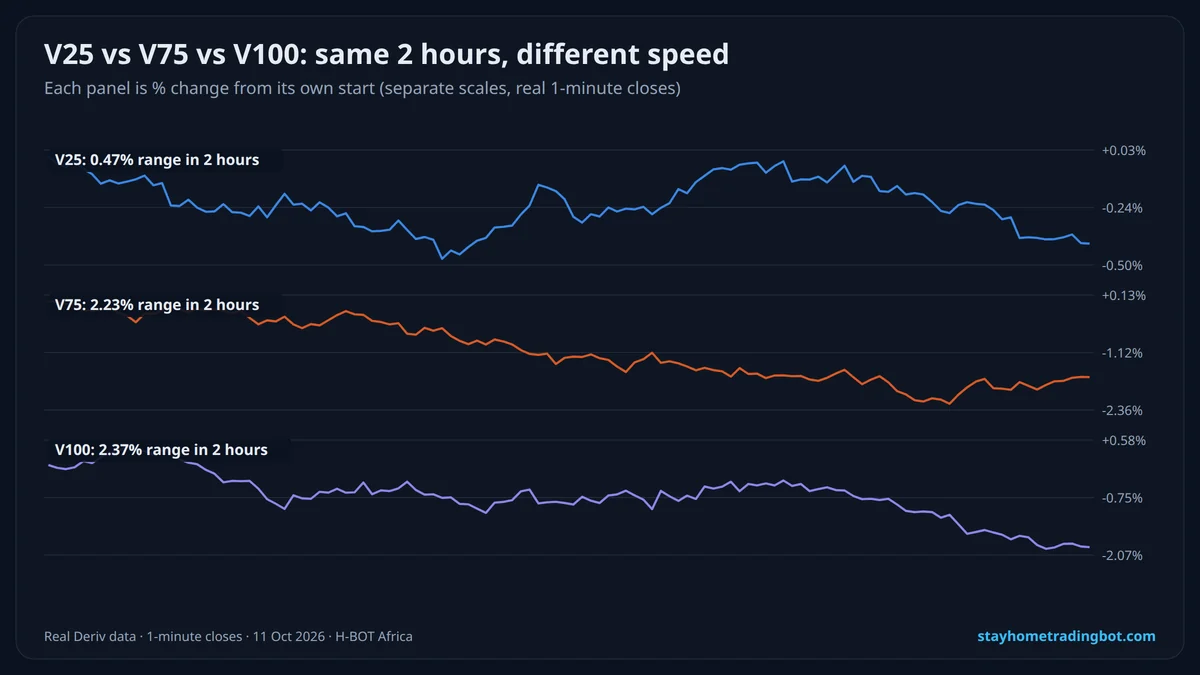
| Volatility | V10, V25, V50, V75, V100 and (1s) versions | Constant volatility; the number is the volatility level |
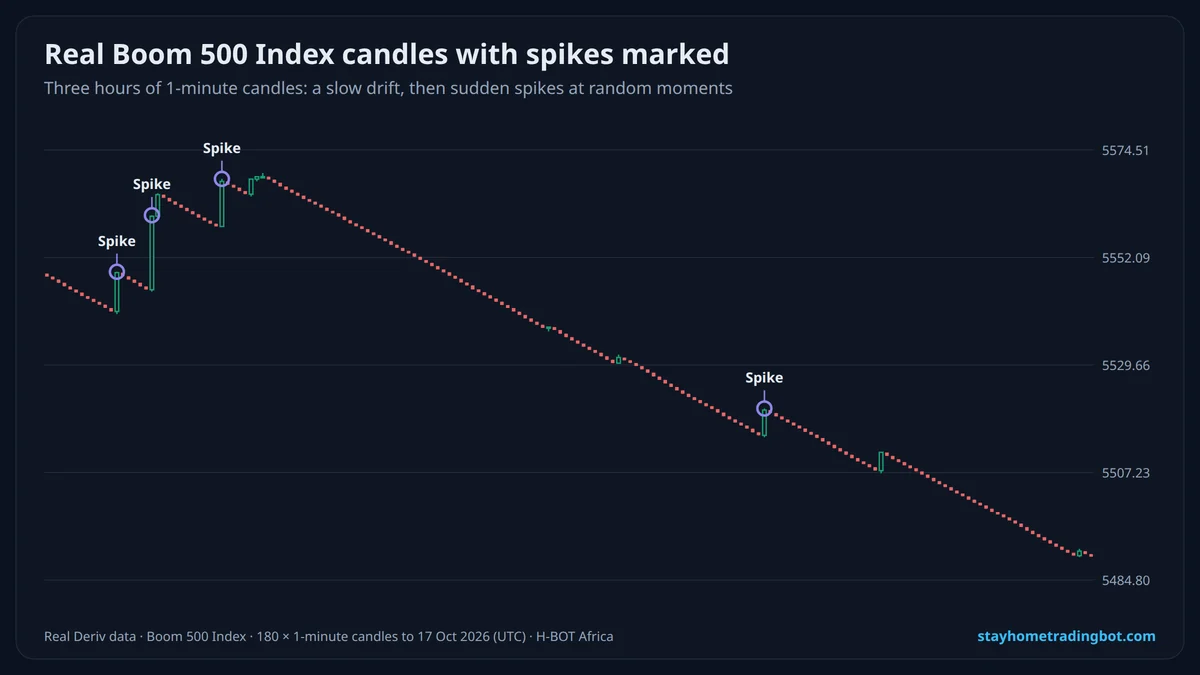
| Boom and Crash | Boom/Crash 50, 150, 300, 500, 600, 900, 1000 | Slow drift with sudden spikes, on average every N ticks |
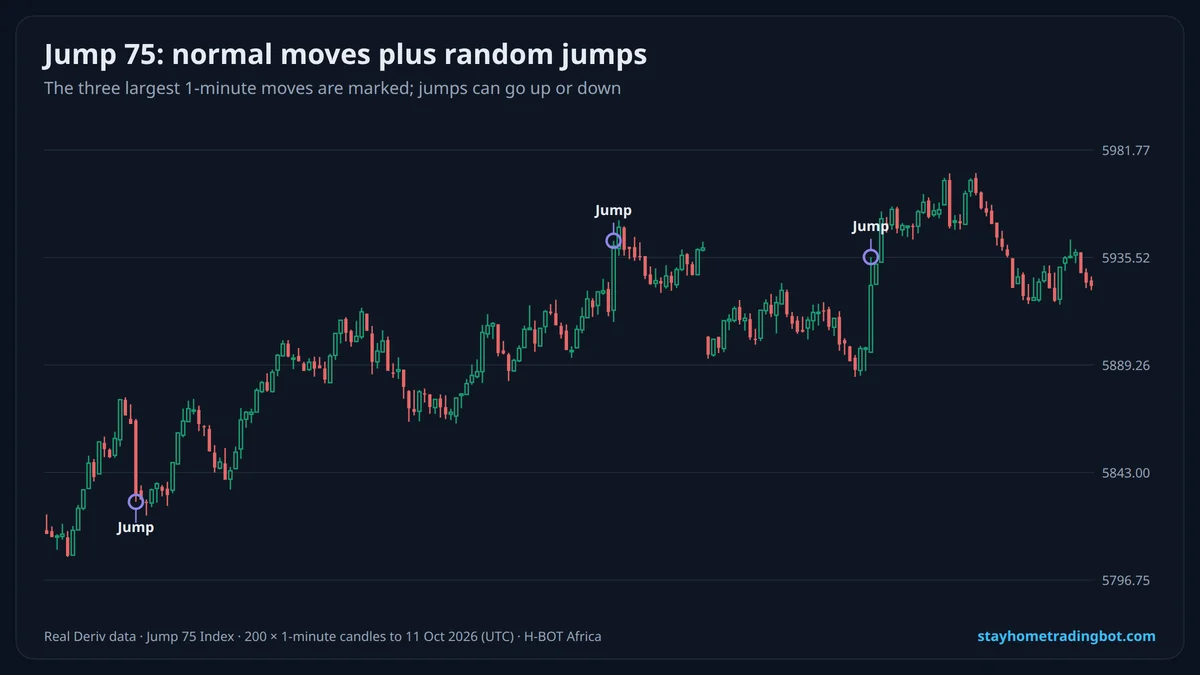
| Jump | Jump 10, 25, 50, 75, 100 | Normal moves plus occasional big jumps either way |
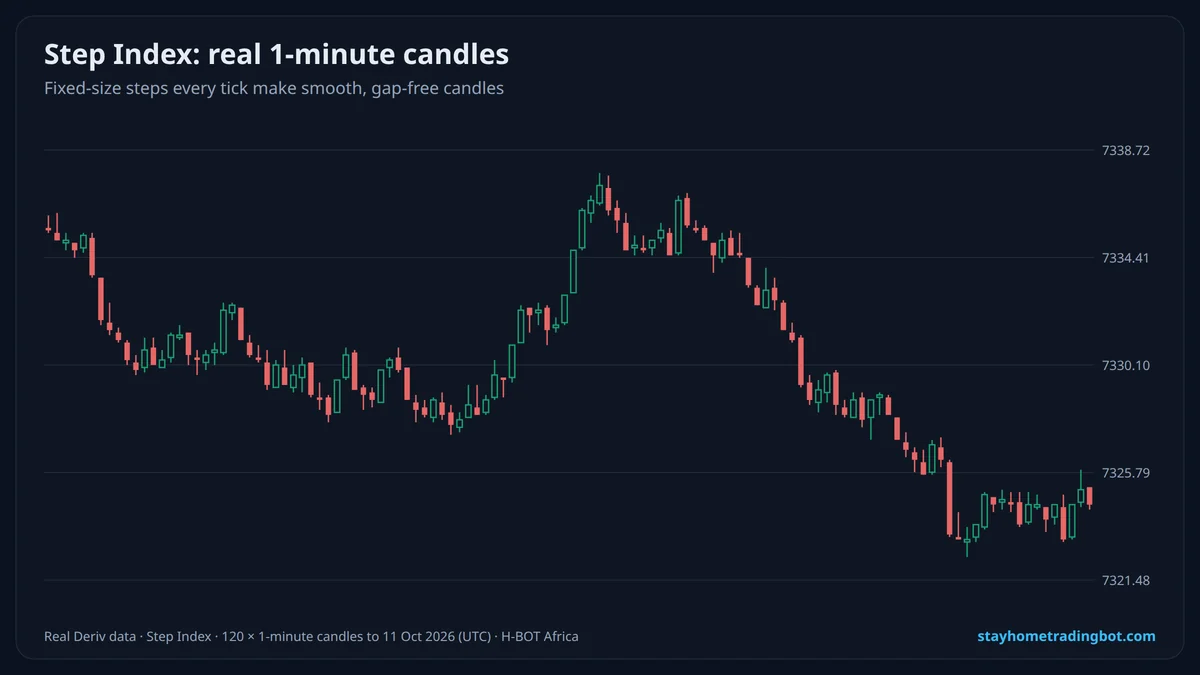
| Step | Step Index 100–500 | Every tick moves up or down by a fixed step |
| Range Break | Range Break 100, 200 | Trades inside a range, then breaks out |
| Bull / Bear Market | Bull Market, Bear Market | Built-in upward or downward drift |
| Baskets | AUD, EUR, GBP, USD baskets; Gold basket | Average of one currency (or gold) against several others |
Which Contracts Work on Which Index?
The contract list depends on the index. On Volatility 100 the public API listed Rise/Fall, Higher/Lower, Touch/No Touch, digits, Accumulators, Multipliers, Turbos, Vanillas, Only Ups/Downs, High/Low Ticks and more. On Boom 500 and Range Break 100 it listed Multipliers (and Accumulators on Boom 500) only. Check the contract menu before building a strategy.
How to Choose an Index
- New to trading: a slow index such as {L("volatility-10-and-25-index", "V10 or V25")}, or the {L("deriv-step-index", "Step Index")}.
- Digit contracts: Volatility indices (see {L("deriv-even-odd-strategy-and-digit-analysis-tool", "Even/Odd")}).
- Spike traders: {L("boom-500-and-crash-500-index", "Boom and Crash")}, with strict stops.
- Big moves: V75, V100 or Jump indices, with smaller stakes.
Are Synthetic Indices Fair?
Deriv says the generator is audited for randomness. Random means no pattern repeats on demand: indicators describe the past but cannot predict the next tick. That is why every guide on this site tests ideas on real data first.
Try It Free on a $10,000 Demo
Open a free Deriv account, connect it to H-BOT Africa and test bots, signals and digit tools on virtual money before risking a shilling.
Open a free Deriv account Open Deriv Bot Open H-BOT Ask on WhatsApp
Have an audience? Become a Deriv partner and earn commission on clients you refer.
Disclosure: some links on this page are Deriv partner links. If you open an account or become a partner through them, H-BOT Africa may earn a commission at no extra cost to you.
Frequently Asked Questions
What are synthetic indices on Deriv?
Deriv’s own 24/7 markets generated by a random number generator, not linked to real-world assets.
How many synthetic indices does Deriv have?
The public API listed 46 on 18 October 2026 across eight families.
Which synthetic index is best for beginners?
A slow one such as Volatility 10 or 25, or the Step Index, on demo first.
What is the Range Break index?
An index that moves inside a range and then breaks out of it.
Can synthetic indices be manipulated?
Deriv states the generator is audited; random prices cannot be predicted by anyone.
Are synthetic indices open on weekends?
Yes, they run 24/7, including weekends and holidays.
 NEW