Boom 500 and Crash 500 Index: How Often Spikes Come, How to Trade Them and the Risks
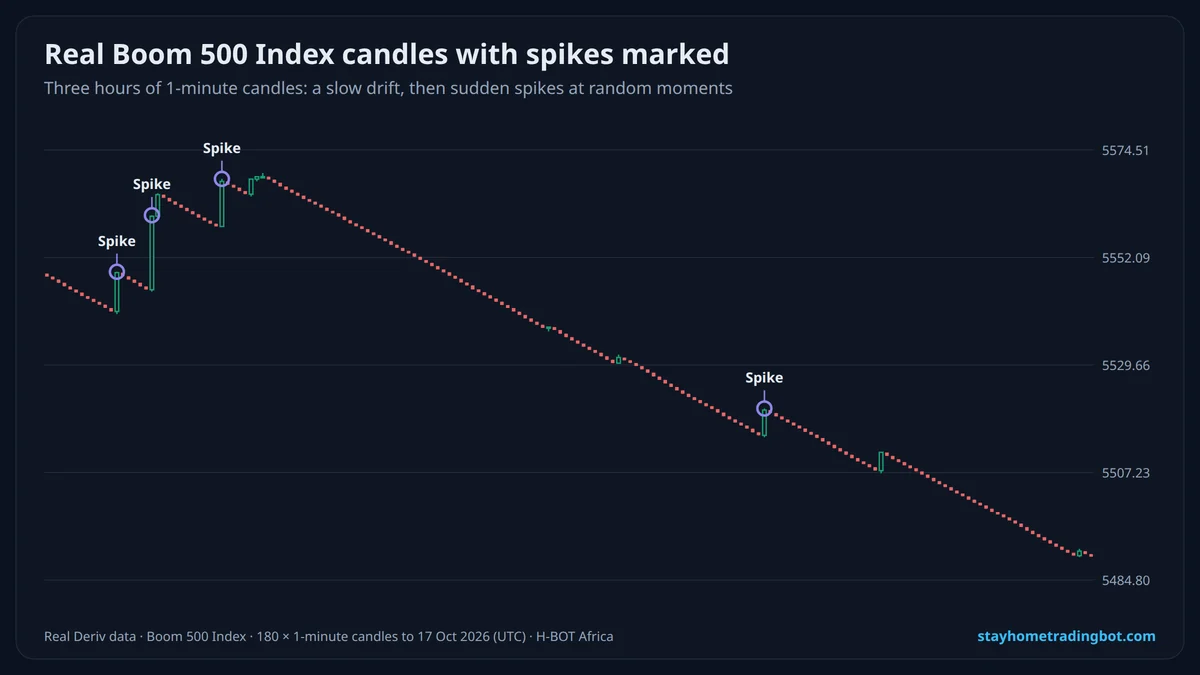
What the Real Ticks Showed
| Boom 500 | Crash 500 | |
|---|---|---|
| Ticks checked (1 per second) | 10,000 | 10,000 |
| Spikes counted | 11 | 17 |
| Shortest gap | 11 ticks | 67 ticks |
| Typical (median) gap | 646 ticks | 425 ticks |
| Longest gap | 2,997 ticks | 1,649 ticks |
| Biggest spike | 15.95 points | 7.53 points |
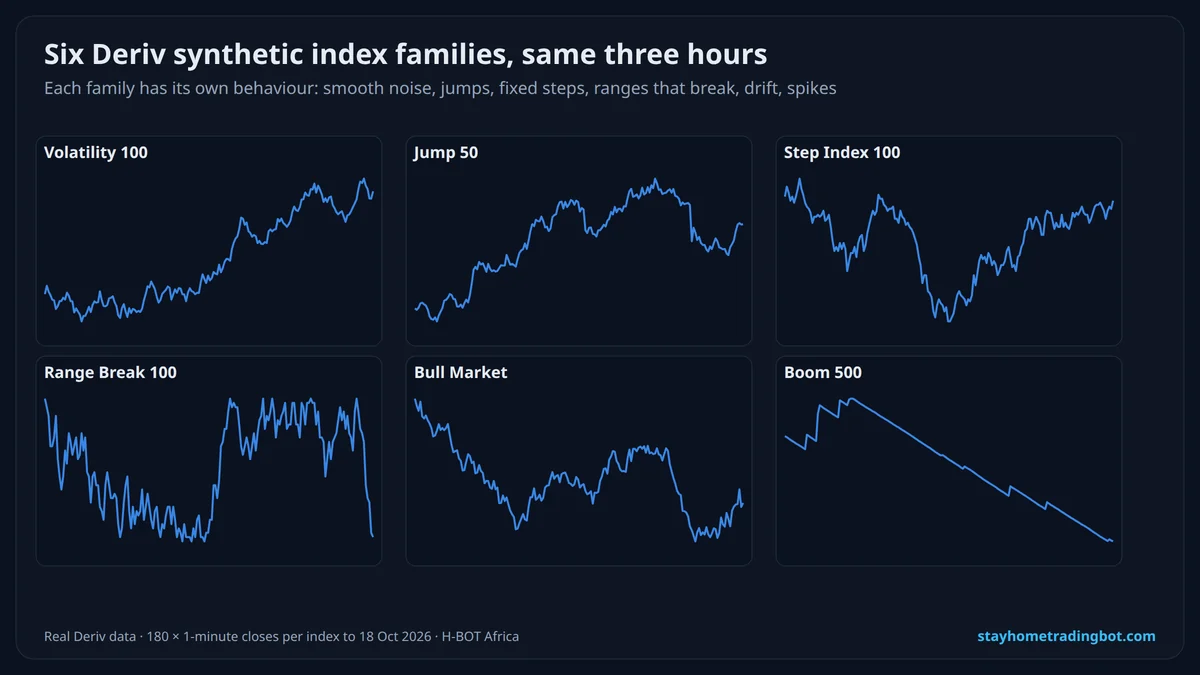
"One spike per 500 ticks" is an average over a long time. In a short window you can wait three times that long, or see two spikes a few seconds apart. A strategy that needs a spike "soon" is a strategy that can lose for an hour.
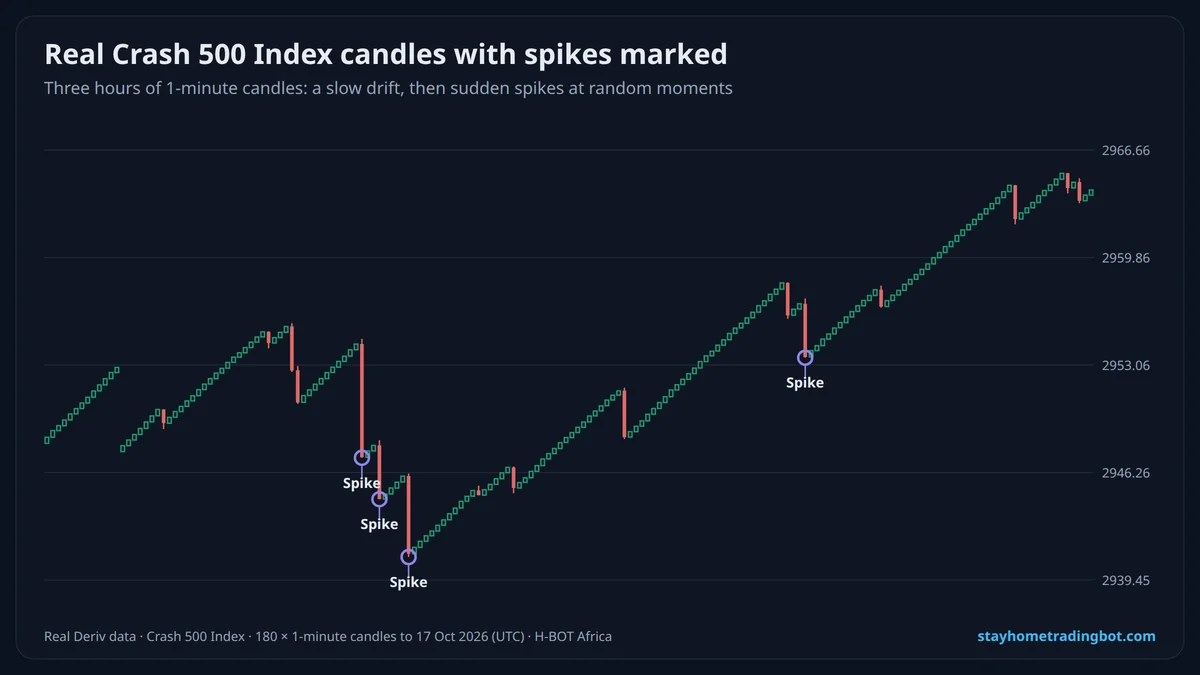
What You Can Trade on Boom and Crash 500
On Deriv’s options platform (Deriv Trader and Deriv Bot) the public contract list for Boom 500 shows Multipliers (Up/Down) and Accumulators. On Deriv MT5 they trade as CFDs with lot sizes. Rise/Fall and digit contracts are not offered on Boom and Crash.
The Two Common Approaches
| Approach | How it makes money | How it loses |
|---|---|---|
| Trade the drift (sell Boom / buy Crash) | Small steady gains between spikes | One spike can wipe out many small gains |
| Catch the spike (buy Boom / sell Crash) | One big move pays | Slow bleed while you wait; spikes may be late |
A Careful Plan
- Practise on demo with a fixed small stake.
- Always use a stop loss on multipliers or MT5; size it for a spike, not for the drift.
- Decide in advance how long you will wait for a spike, and accept the loss when time runs out.
- Risk at most 1–2% per trade; read {L("trading-risk-management", "risk management")}.
- Avoid "spike signal" sellers who promise timing (see {L("deriv-signals-telegram", "Telegram signals")}).
Try It Free on a $10,000 Demo
Open a free Deriv account, connect it to H-BOT Africa and test bots, signals and digit tools on virtual money before risking a shilling.
Open a free Deriv account Open Deriv Bot Open H-BOT Ask on WhatsApp
Have an audience? Become a Deriv partner and earn commission on clients you refer.
Disclosure: some links on this page are Deriv partner links. If you open an account or become a partner through them, H-BOT Africa may earn a commission at no extra cost to you.
Frequently Asked Questions
How often does Boom 500 spike?
On average once every 500 ticks according to Deriv, but in our real data gaps ranged from 11 to 2,997 ticks.
What is the best time to trade Boom 500?
There is none; the index behaves the same at every hour.
Can I trade Rise/Fall on Boom 500?
No. The options list shows Multipliers and Accumulators; MT5 offers CFDs.
What is the difference between Boom 500 and Boom 1000?
Boom 1000 averages one spike per 1,000 ticks, so spikes come half as often.
Can spikes be predicted?
No. The timing is random; indicators cannot predict the next spike.
Is there a minimum lot size?
Yes on MT5; it is shown in the symbol specification for your account.
Related Guides
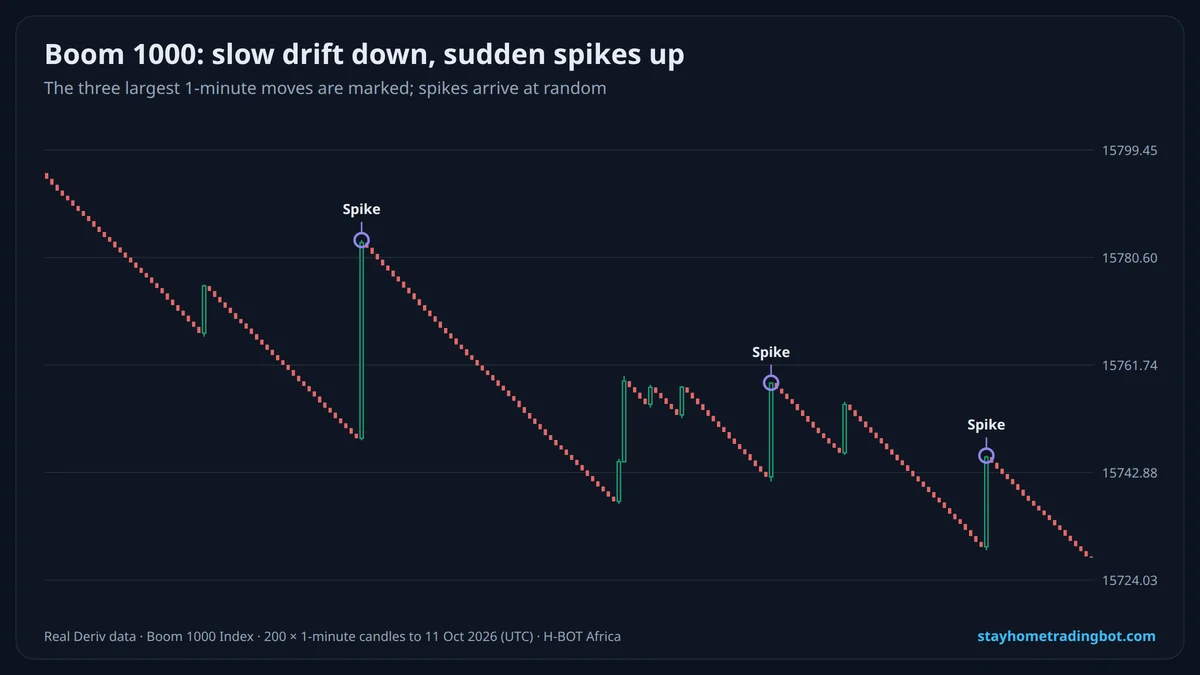 Boom and Crash Indices: How the Spikes Work, Strategies People Use and the Real Risks
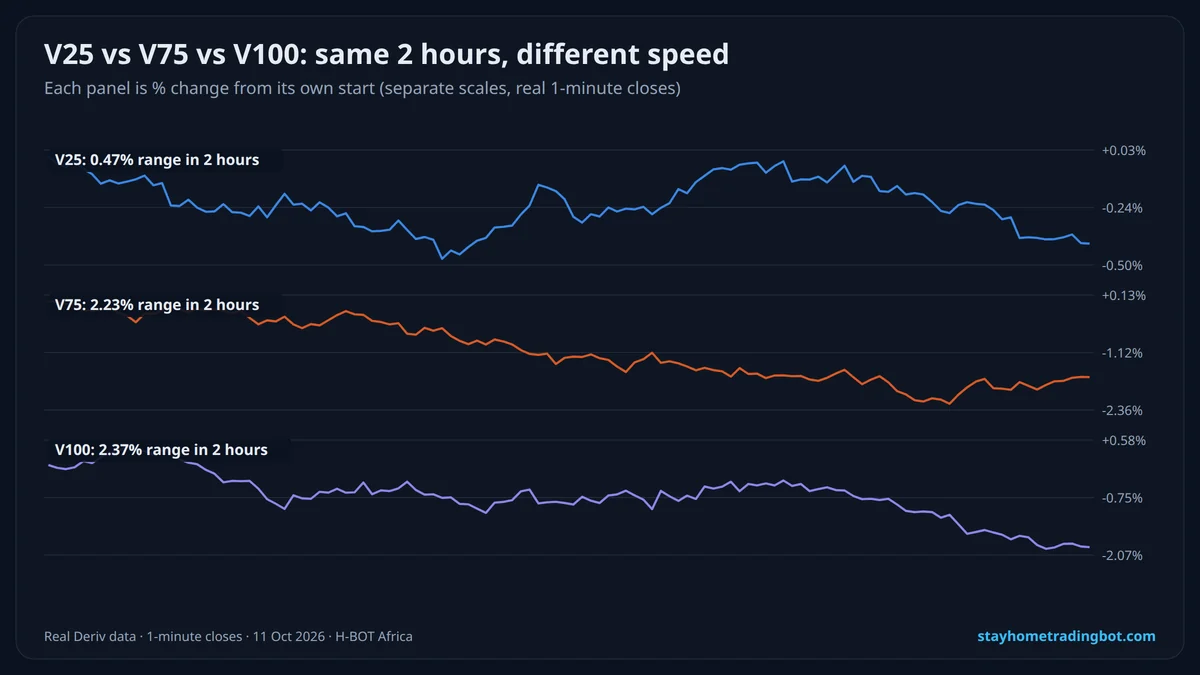 Deriv Multipliers Explained: How They Work, Stop-Out, Deal Cancellation and Safer Use
 NEWDeriv Synthetic Indices Explained: Volatility, Boom and Crash, Jump, Step, Range Break and More
 Risk Management for Deriv Traders: Stake Size, Stop-Loss and Daily Limits That Protect Your Account