Boom and Crash Indices: How the Spikes Work, Strategies People Use and the Real Risks
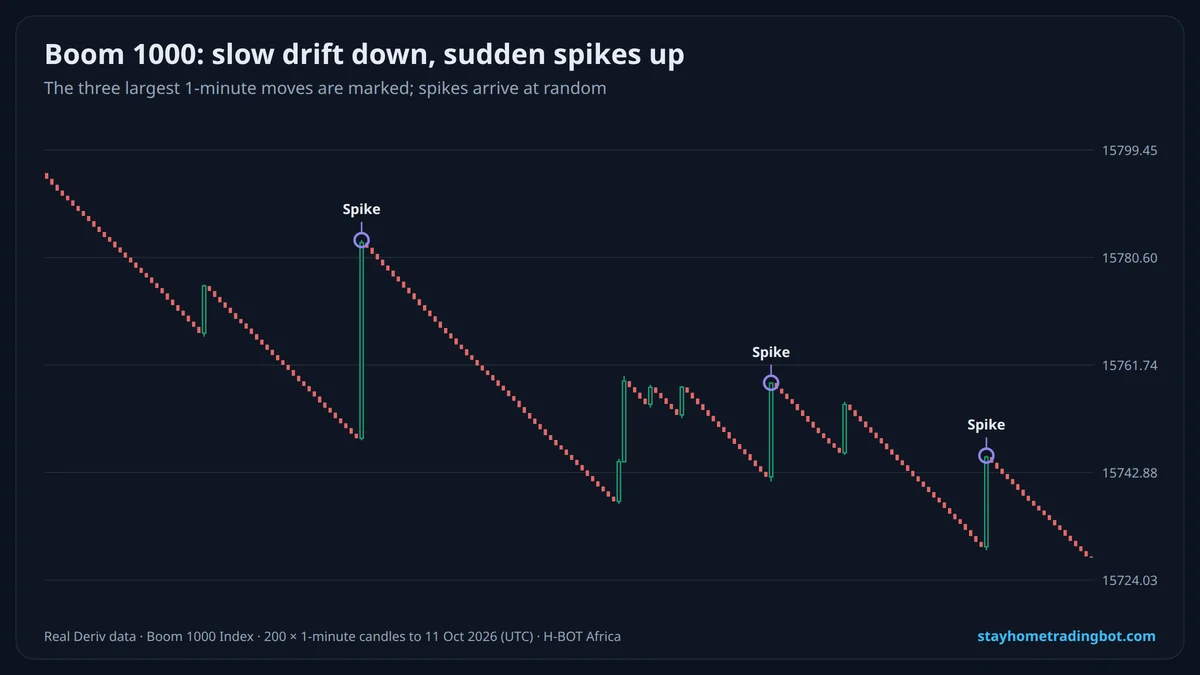
What Are Boom and Crash Indices?
| Index | Drift between spikes | Spike direction | Average spike frequency |
|---|---|---|---|
| Boom 300 / 500 / 1000 | Gradually down | Up | About 1 in 300 / 500 / 1000 ticks |
| Crash 300 / 500 / 1000 | Gradually up | Down | About 1 in 300 / 500 / 1000 ticks |
Because each tick has the same small chance of being a spike, a spike can come twice in a row, or not for several thousand ticks.
Where Can You Trade Boom and Crash?
Boom and Crash are traded mainly as CFDs on Deriv MT5 (and as multipliers where offered on your account). They are not digit contracts, so digit tools do not apply.
Strategies Traders Use
- Trading the drift: selling Boom or buying Crash between spikes to capture the slow drift, with a tight stop in case a spike hits.
- Catching the spike: buying Boom (or selling Crash) waiting for a spike. Many small losses while waiting, occasional large win.
- Trend filters: using moving averages on higher timeframes to choose direction.
None of these predicts a spike. They only shape how wins and losses are distributed.
The Biggest Risk: Lot Size
A single spike can move price sharply against a drift trade. Without a stop-loss, one spike can wipe a small account. Start with the minimum volume, risk no more than 1–2% of your balance per trade, and never add to a losing trade.
How H-BOT Africa Helps
Use the KE Chart for structure, set a daily loss limit, and log every trade in the journal. See also risk management.
A Demo Practice Plan (One Week)
- Day 1: watch Boom 1000 and Crash 1000; note the time between spikes.
- Day 2–4: demo trades with minimum volume and a stop-loss.
- Day 5: count how many trades a spike stopped out.
- Day 6–7: set your size so a spike costs at most 1–2% of the balance.
Common Mistakes
- Assuming a spike is "due".
- Adding to losing positions.
- No stop-loss on drift trades.
- Large lot size on a small account.
Try It Free on a $10,000 Demo
Open a free Deriv account, connect it to H-BOT Africa and test bots, signals and digit tools on virtual money before risking a shilling.
Open a free Deriv account Open Deriv Bot Open H-BOT Ask on WhatsApp
Have an audience? Become a Deriv partner and earn commission on clients you refer.
Disclosure: some links on this page are Deriv partner links. If you open an account or become a partner through them, H-BOT Africa may earn a commission at no extra cost to you.
Frequently Asked Questions
What is the best strategy for Boom 1000?
No strategy predicts spikes. Traders either trade the drift with a tight stop or wait for spikes with small size; both need strict risk control.
How often does Boom 1000 spike?
On average about once every 1,000 ticks, but randomly: two spikes can come close together, or none for a long time.
Can I trade Boom and Crash on Deriv Trader?
They are traded mainly on Deriv MT5 as CFDs, and as multipliers where your account offers them.
What lot size is safe on Boom and Crash?
Start with the minimum volume and risk no more than 1–2% of your balance per trade with a stop-loss.
Is Boom and Crash rigged?
They come from Deriv’s random number generator. Random spikes are exactly why "due" spikes are a trap.
Which is easier, Boom or Crash?
They mirror each other: Boom spikes up, Crash spikes down. Neither is easier.
Related Guides
 Volatility 75 Index (V75): What It Is, How It Works and How to Trade It
 Deriv Step Index: How It Moves, Strategies and Risk Settings
 Risk Management for Deriv Traders: Stake Size, Stop-Loss and Daily Limits That Protect Your AccountDeriv Multipliers Explained: How They Work, Stop-Out, Deal Cancellation and Safer Use