Ichimoku Cloud Strategy: The Five Lines, How to Read the Cloud and a Test on Real V75 Candles
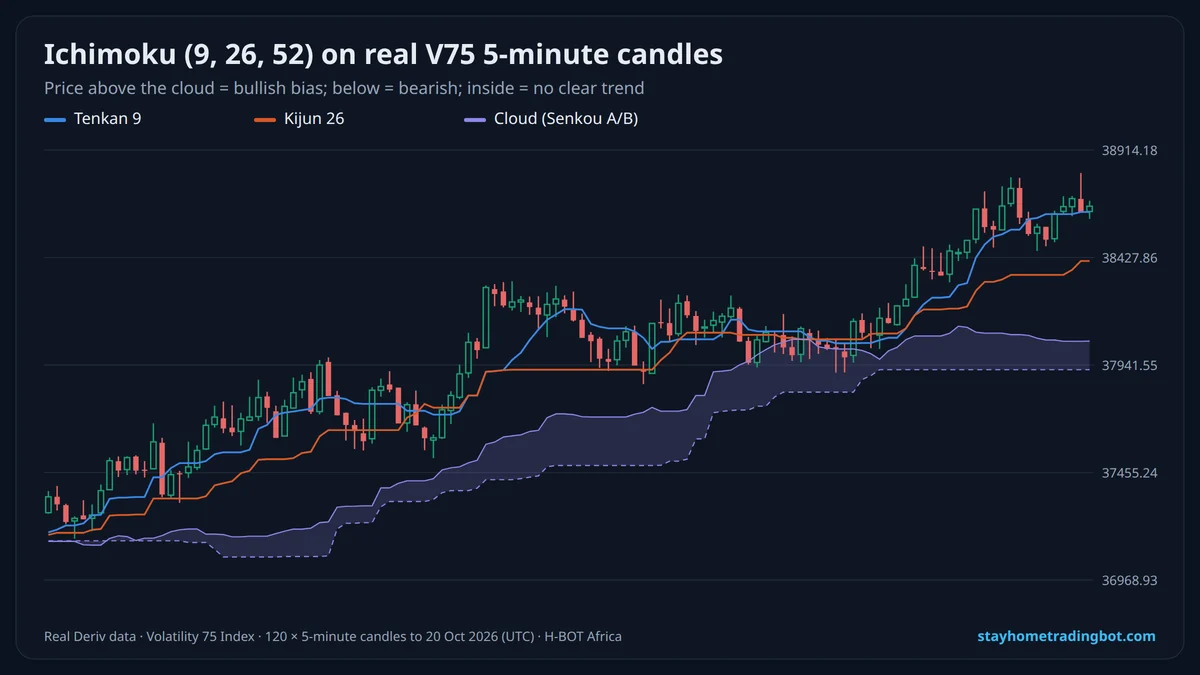
The Five Ichimoku Lines
| Line | How it is calculated | What it shows |
|---|---|---|
| Tenkan-sen (conversion) | Middle of the 9-period high and low | Short-term balance |
| Kijun-sen (base) | Middle of the 26-period high and low | Medium-term balance; often support or resistance |
| Senkou Span A | (Tenkan + Kijun) ÷ 2, shifted 26 periods ahead | One edge of the cloud |
| Senkou Span B | Middle of the 52-period high and low, shifted 26 ahead | The other edge of the cloud |
| Chikou Span (lagging) | Today’s close, shifted 26 periods back | Confirms the trend against past prices |
Three Common Ichimoku Signals
- Cloud breakout: price closes above (or below) the whole cloud.
- TK cross: Tenkan crosses above Kijun (bullish) or below (bearish).
- Kijun bounce: in a trend, price pulls back to Kijun and continues.
Real Test on Volatility 75
| Signal (500 V75 5-minute candles) | Signals | Moved the signal way over the next 6 candles |
|---|---|---|
| Cloud breakout | 20 | 65% |
| Tenkan/Kijun cross | 18 | 44% |
With samples this small, a 65% result can easily be luck. The cloud is still useful as a visual filter: many traders only take Rise or multiplier Up trades when price is above the cloud.
Ichimoku for Scalping?
Ichimoku needs 52 candles before the cloud is complete and shifts lines 26 periods, so on 1-minute charts it reacts slowly to a fast index. Most traders use it on 5-minute to 1-hour charts.
Try It Free on a $10,000 Demo
Open a free Deriv account, connect it to H-BOT Africa and test bots, signals and digit tools on virtual money before risking a shilling.
Open a free Deriv account Open Deriv Bot Open H-BOT Ask on WhatsApp
Have an audience? Become a Deriv partner and earn commission on clients you refer.
Disclosure: some links on this page are Deriv partner links. If you open an account or become a partner through them, H-BOT Africa may earn a commission at no extra cost to you.
Frequently Asked Questions
How do you use the Ichimoku Cloud?
Trade in the direction of price relative to the cloud, and use Tenkan/Kijun crosses for timing.
What are the best Ichimoku settings?
The standard 9, 26, 52. Some crypto traders use 20, 60, 120.
What does it mean when price is inside the cloud?
There is no clear trend; many traders stay out.
Is Ichimoku good for Deriv synthetic indices?
It describes trend well, but our small test showed no reliable edge.
What is a TK cross?
Tenkan-sen crossing Kijun-sen; above is bullish, below is bearish.
Is Ichimoku good for scalping?
It reacts slowly on 1-minute charts; most use it on 5-minute and higher.
Related Guides
 Moving Average Strategy for Deriv: Crossovers, Trend Filters and Settings
 NEWADX Indicator Explained: Best Settings, +DI and −DI, and What a Test on Real V75 Candles Showed
 Support and Resistance on Deriv: How to Draw Levels and Trade Them Safely
 Best Indicators for Deriv Synthetic Indices: Which to Use and How to Combine Them